Symbology
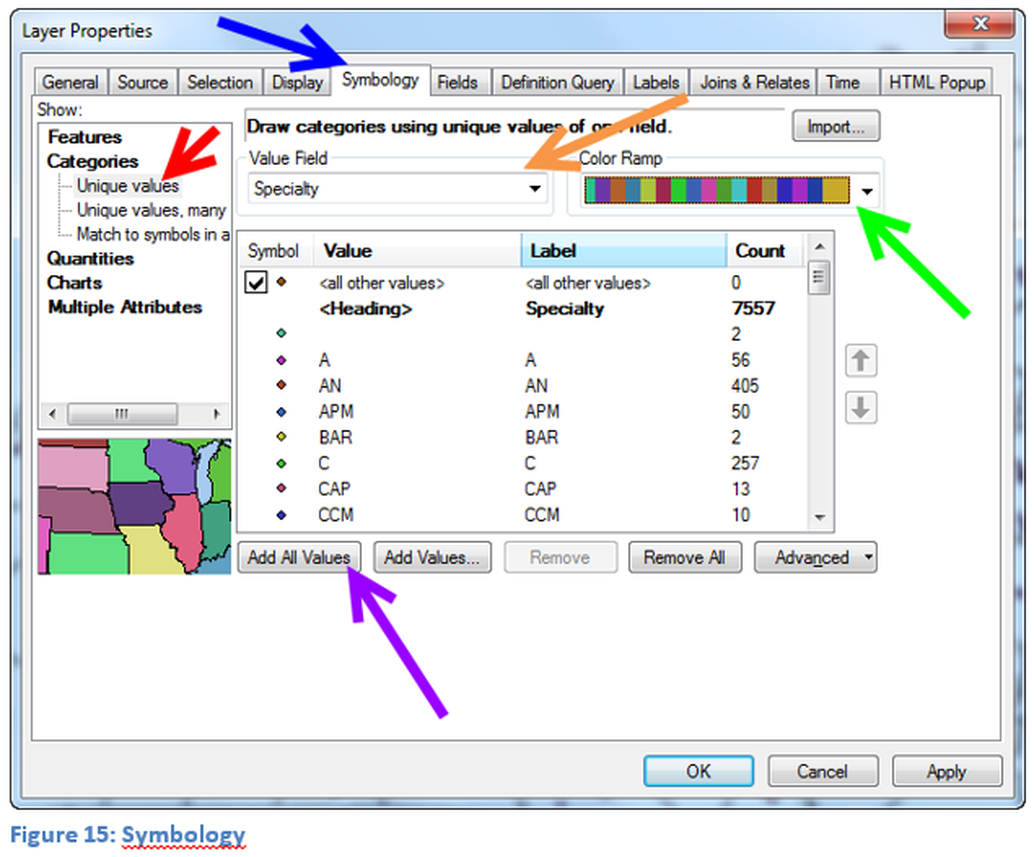
Once the geocoding process has completed a classification of doctor specialization might be done. The doctor specialization was included in the data set and thus included in the shapefile that was created. A basic understanding of Symbology is expected for this part of the module, if additional assistance is required review the Symbology module before proceeding with this information. The data set will be the geocoded doctors. Open the properties window of the doctor layer and click on the Symbology tab (blue arrow). Select the Value Field and then select Specialty (orange arrow). Next select Categories and select Unique Values (red arrow). Make sure that Add All Values (purple arrow) has been selected and then select an appropriate set of ramp colors (green arrow). If more than one doctor is at the same address and they have different specialty only one doctor will appear unless the symbols are different sizes for different specializations on the map.
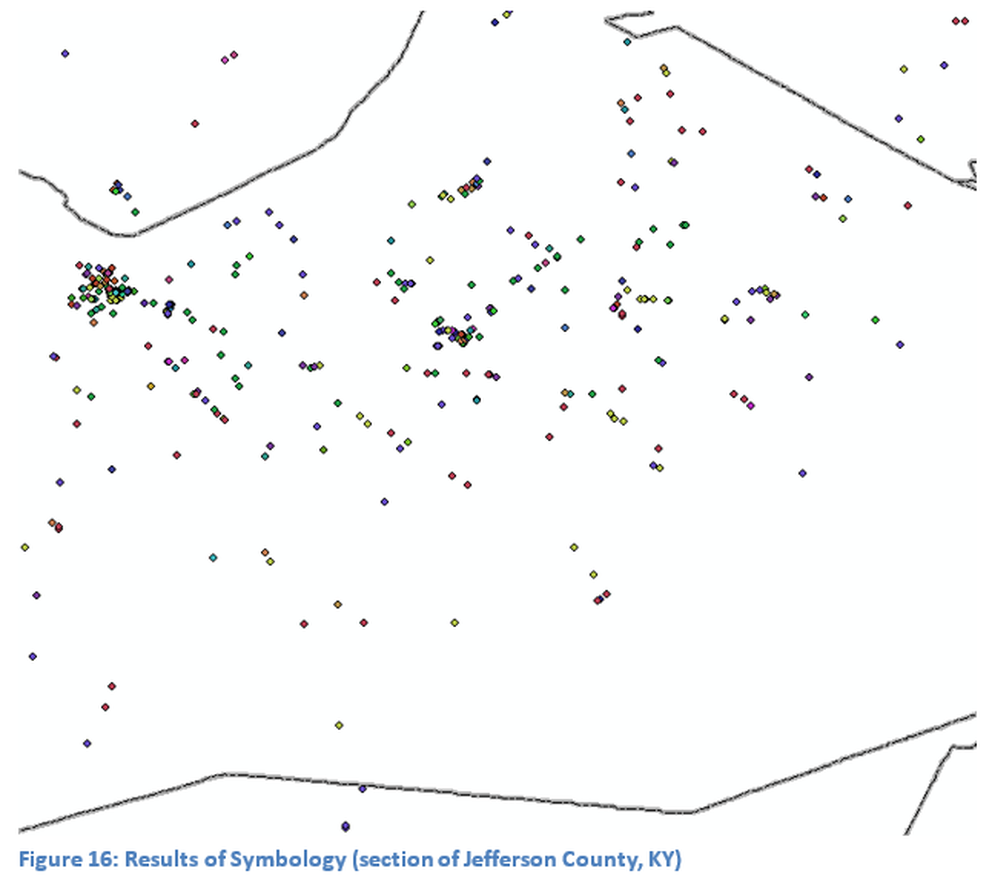
In figure 16 a part of Jefferson County, KY is visible. Different colors of symbols are now visible compared to the single color symbol in Figure 14. This is not a final map since it does not contain roads to identify locations for these data points, nor does it contain a legend so that the types of doctors can be determined. A query of the data set could be done to show only specific specializations. The final map production would need to be in publishable format, if the legend has abbreviations they must be explained in a written document.
This completes the module on geocoding the following skills were obtained:
This completes the module on geocoding the following skills were obtained:
- Loading an Excel spreadsheet.
- Make modifications to the spreadsheet.
- Using a standard locator file to geocode the spreadsheet data.
- Understanding of threshold levels.
- How to manually recode information.

