Joining a Shapefile with Table Data
Selecting a Shapefile
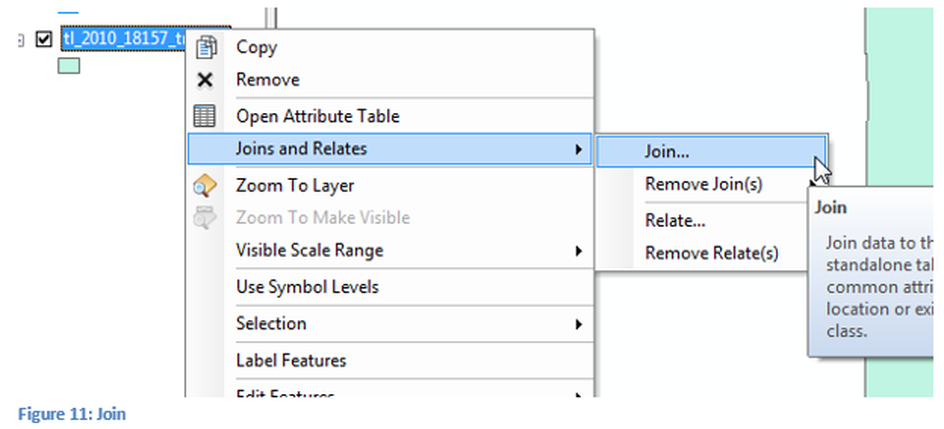
Right click on the name of the census tract shapefile to be joined, for this example it is the Tippecanoe County file. Click on Joins and Relates, then select Join to open the Join Data window, see Figure 11.
Selecting Type of Join
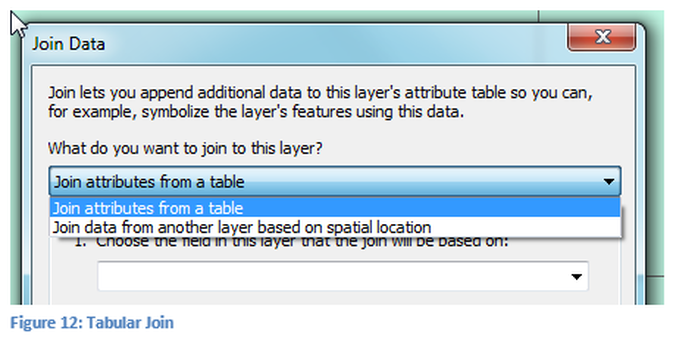
There are two types of joins, using the drop arrow, seen in figure 12, select table join. This is the first step in the tabular joining process. There is a separate technical skills lesson for spatial joins.
In these next steps a common field in the table file and the shapefile will be selected so that information can be accurately combined together. If a common field is not present a tabular join cannot be completed. If the common field is not known look at the attributes of both files. To do this Right Click on the file name and open attribute table, do not modify anything in this table, the tabular join window must be closed to
explore the attributes of the files, once the common fields are determined return to this location. If modifications are required after reviewing in information they must be accomplished prior to returning to the tabular join process.
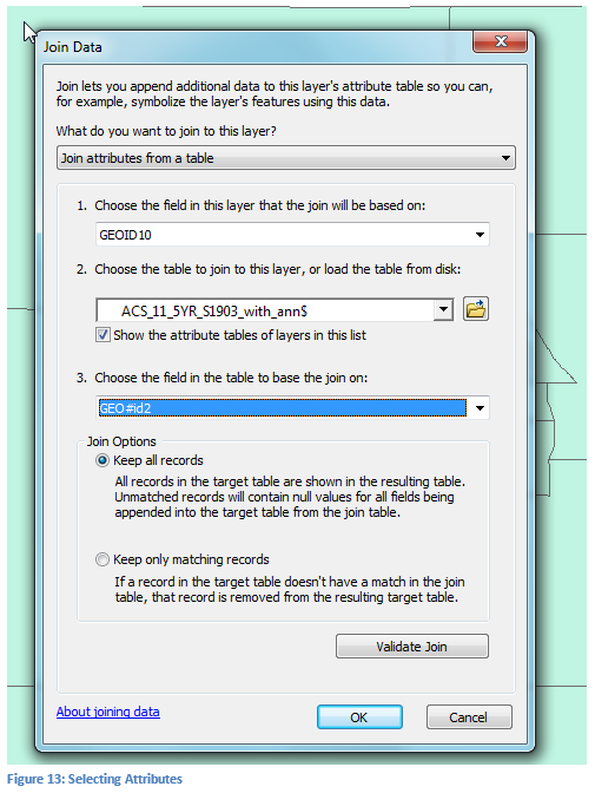
In the first step the attribute of the shapefile was selected, see Figure 13. The shapefile did not need to be specified since this operation began by right clicking on the name of the shapefile. In the next step click on the folder icon, if the data is not loaded on the map, or use the pull down arrow if the data is loaded on the map. The next step will be to open the spreadsheet and select the proper one (Microsoft Excel has multiple sheet types). In the final step select the column which has the same information as GEOID10. For this example in the pull down menu GEO#id2 was selected. If the proper field is not visible through the use of the pull down, then there is a data field type mismatch. Exit the join process in Esri ArcMap correct the field type mismatch and return to the Join Data window. The name was changed because it had a period in the original name and that is not an accepted symbol. Click on Validate Join prior to actually attempting the tabular join. This is not a required step but is a quick method to determine if the join will work and may save time if the tabular join is potentially going to fail.
In the first step the attribute of the shapefile was selected, see Figure 13. The shapefile did not need to be specified since this operation began by right clicking on the name of the shapefile. In the next step click on the folder icon, if the data is not loaded on the map, or use the pull down arrow if the data is loaded on the map. The next step will be to open the spreadsheet and select the proper one (Microsoft Excel has multiple sheet types). In the final step select the column which has the same information as GEOID10. For this example in the pull down menu GEO#id2 was selected. If the proper field is not visible through the use of the pull down, then there is a data field type mismatch. Exit the join process in Esri ArcMap correct the field type mismatch and return to the Join Data window. The name was changed because it had a period in the original name and that is not an accepted symbol. Click on Validate Join prior to actually attempting the tabular join. This is not a required step but is a quick method to determine if the join will work and may save time if the tabular join is potentially going to fail.
Validate Join
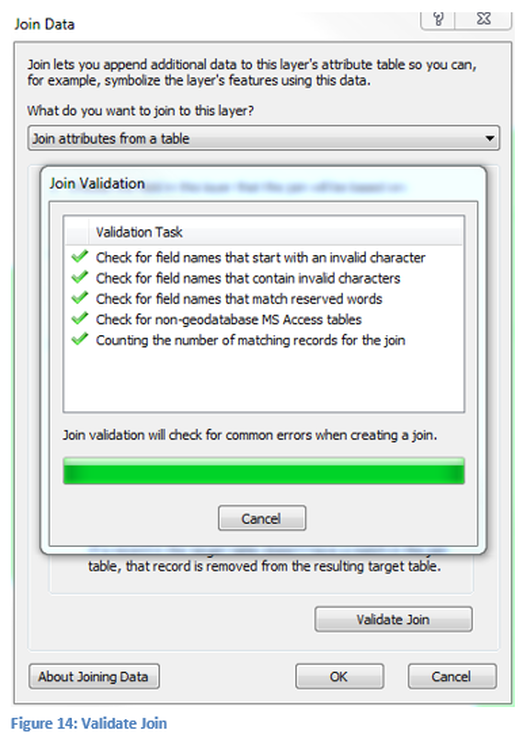
Click Cancel to continue.
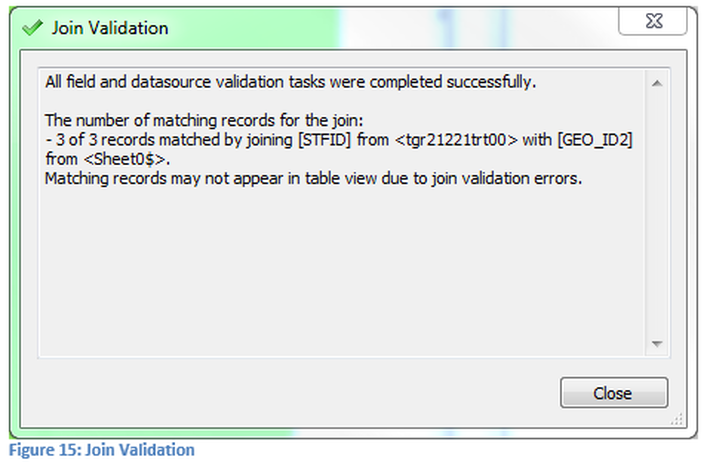
Close the window in Figure 15: Join Validation will automatically return to the window in Figure 13, by Clicking Close. Click OK on the Join Data window for the operation to be executed. When the join process has been completed, no new files are created as in many of the other geospatial processes, therefore the result of the tabular join process will need to be exported to a new shapefile to make the results permanent.
Export Data
At this point the tabular join process has been completed and the two files have been joined together, but a new shapefile of the tabular joined information has not been created. If ArcMap was closed the join would be lost and it cannot be used by others, since the process has not created a new shapefile.
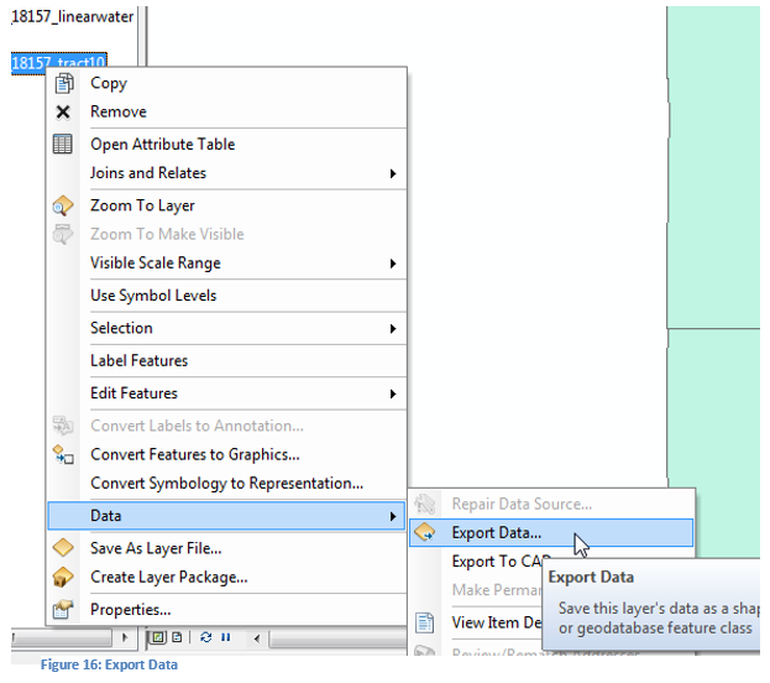
Right Click on the shapefile again and select Data. Another window will open as seen in Figure 16 and select Export Data. This process will create a new shapefile, this is a very important part of the process.
Right Click on the shapefile again and select Data. Another window will open as seen in Figure 16 and select Export Data. This process will create a new shapefile, this is a very important part of the process.
This process allows the creation of a new shapefile, the user should select a storage location and a descriptive name. Make sure that the shapefile is placed in an appropriate folder or geodatabase so that it can be located in the future.
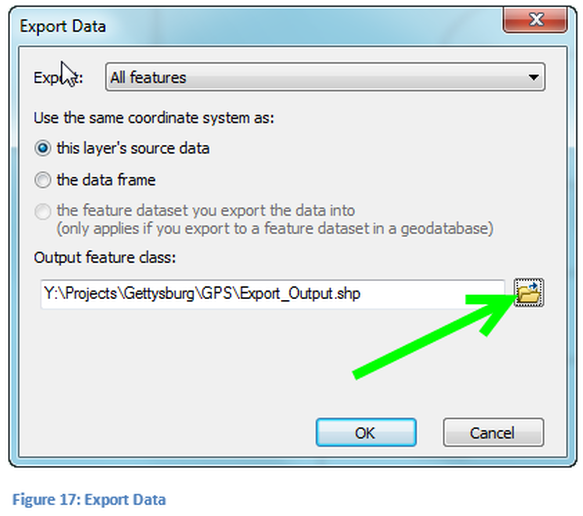
Click on the file folder; and select a location that is logical for the shapefile and the type of information. As can be seen in Figure 17 this would not be the proper storage location to save data about an Indiana county. Open the file folder icon and browse to the appropriate location, select OK.
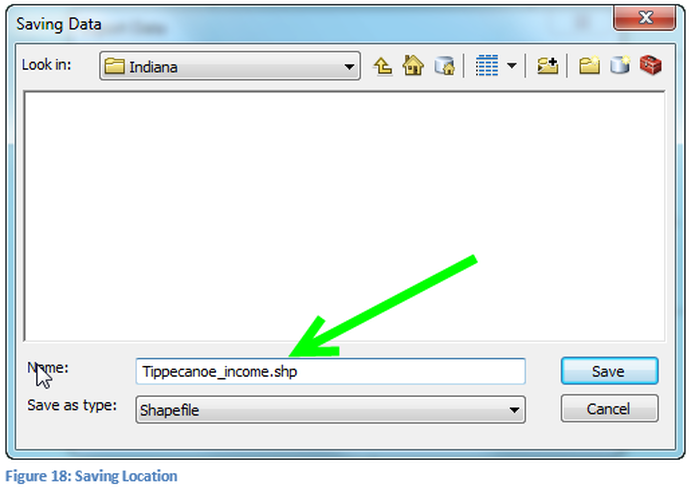
After selecting the appropriate saving location, select an appropriate name for the file. Note: the file is now being saved in the Indiana folder. Select Save, as seen in Figure 18
New Shapefile
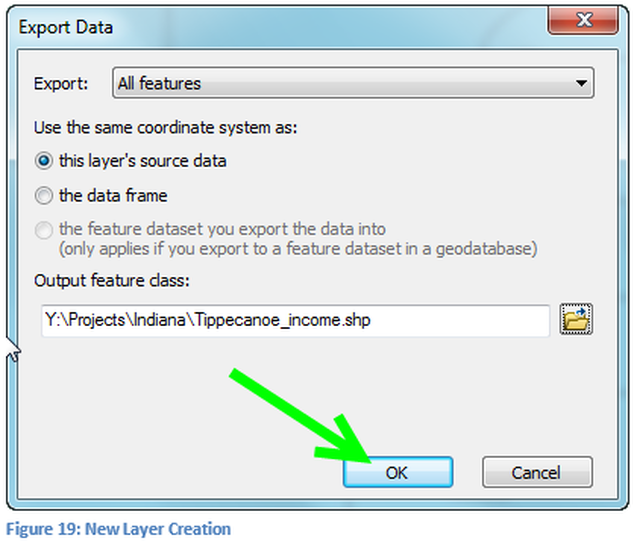
The final step of the process is to export the new shapefile by clicking OK, see Figure 19.
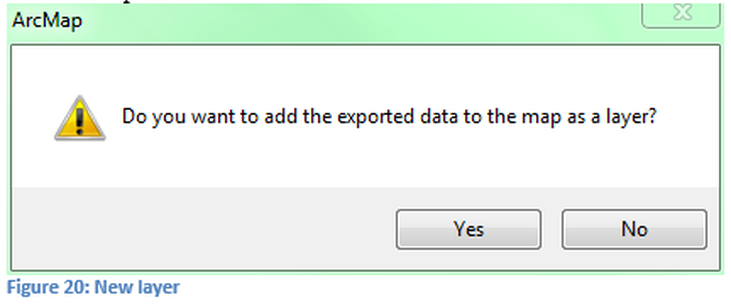
After the shapefile has been saved, a window like Figure 20 will appear, wanting to know if the new shapefile should be loaded as a layer on the current map. The layer should be added to the current map.
Removing Data
Once the new shapefile has been added to the map the original shapefile can be removed, but at times a hollow filled boundary file can be useful and thus removing it is not always the correct choice. The Excel data file should be removed. Remember the color of the displayed map may be different than this example.
The next steps in the process would be to use the Symbology tab of the Layer Property window to set up appropriate break points and ramp colors to continue the analysis. For how to set-up Symbology properly refer to the technical skills lesson on that topic.
The next steps in the process would be to use the Symbology tab of the Layer Property window to set up appropriate break points and ramp colors to continue the analysis. For how to set-up Symbology properly refer to the technical skills lesson on that topic.

