Downloading Data

Introduction
Much of the data downloaded for map analysis is in the form of shapefiles and raster images; usually a shapefile with a single purpose and selected from a table or a map. There are a multitude of sources of geospatial data, one of the best for demographical data is the United States Census Bureau (http://census.gov). The U.S. Census Bureau has numerous shapefiles with different geographical areas and divisions, as well as tabular data associated with specific geographical regions. Since these pages are controlled by an outside agency realize the location of the pages and how information is accessed may change without notification. Census data is divided into several different levels, the smallest level is the block, blocks make up the block group, and block groups make up the census tract. Census Tracts do not cross county boundaries. The additional divisions are counties, states and the whole country. Generally, much of the demographic research is completed at the census tract level since it has a wide variety of data available. Every county will contain at least one census tract and they will not cross county lines. Realize that regions with higher populations will contain more census tracts, it is suggested for initial use that a single county that has a smaller population with about ten census tracts be used. This example will be using a county with a large population
This technical skills lesson will be divided into two parts, one part will deal with the downloading of shapefiles and the other part with the downloading of tabular data. The hyperlink to the data sources will be given, since navigation of the website changes, hopefully the links will remain consistent.
The census bureau, as mandated by the U.S. Constitution, must collect population data every ten years. This data must have geographical locations and is reported to the U.S. Congress so that the districts for the House of Representatives can be modified as required by law, since these seats are based upon population. This redistricting may mean the loss of congressional seats from states and the gain of seats by other states. This information is also used by individual states to draw their districts for state legislatures. In addition to the constitutional mandate the U.S. Census Bureau collects and maintains a wide variety of other data. The American Community Survey (ACS) provides a wide variety of information that can be used in demographical research such as population, educational level, race and ethnicity, income, age, living structures, transportation, etc. The ACS data that will be used is a five year rolling average, adjusted for inflation as needed and is released in December of each year. For example, ACS 2015 contains the years of 2014, 2013, 2012, 2011, and 2010. ACS 2016 drops the year 2010 and 2015 will be added, the same method is used for future years. ACS data is released at the census tract level and that is one of the reason it used for research.
The census conducted every ten years is known as the Decennial Census. In this census the Census Bureau attempts to count every individual, but only asks a limited number of questions, such as age, race, etc. For the ACS census a smaller percentage of the population is surveyed but a much larger group of questions are asked. The accuracy of the Decennial Census is very good since it surveys such a large percentage of the population, while there are larger errors associated with ACS information. The Decennial Census is a great source of historical information used in genealogical research. Census tract rarely change shape until the decennial census at that time tracts can be split, etc. still maintaining at least one tract per every county.
The U.S. Census Bureau, beyond having a vast varied of tabular information, is also the creator of many of the shapefiles that are used in geospatial research. The census bureau is much more than just a people counter. The census bureau creates and is a repository for shapefiles of geographical divisions, as stated above, as well as townships, congressional districts (state and national), zip codes, school districts, roads, landmarks, rail, water (lakes and streams), etc. Therefore, the census bureau is a prime source for both tabular and geographic information.
Downloading Shapefiles from the U.S, Census Bureau
In this part of the lesson downloading of shapefiles from the Census Bureau will be discussed. This process it is somewhat unique compared to downloading from other sources. The shapefiles are part of the TIGER/Line project and are updated regularly. Therefore if a particular geography has not been explored recently it always good to download new shapefiles of the area of study.
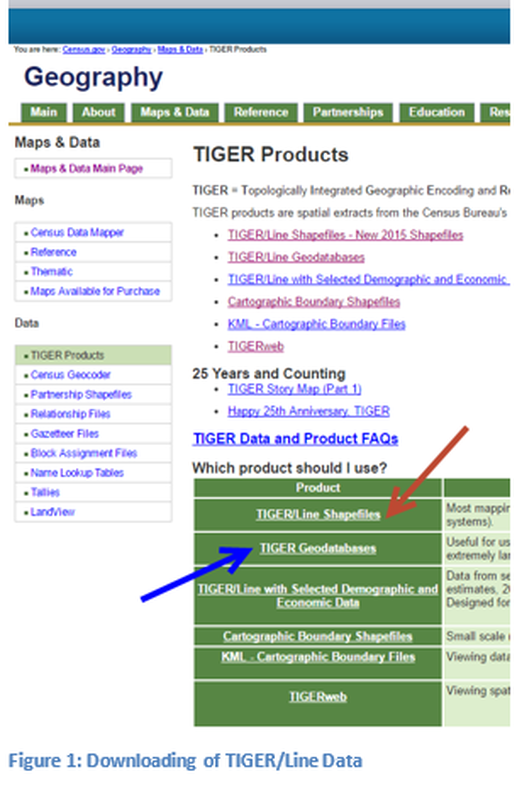
Hyperlinks will be provided, if the address location changes it may require the user to search online for the TIGER/Line data from the census bureau. Goto: https://www.census.gov/geo/maps-data/data/tiger.html a portion of the website has been copied in Figure 1. The top arrow is pointing to the method which will be used to download shapefiles. The lower arrow is pointing to the method to download information as a geodatabase, either method may be used. In general when downloading the information in a geodatabase more data is provided for a larger geographical region such as an entire state as opposed to census tracts for a single county. If the statewide data is downloaded the appropriate information can be queried for the required information extraction.
Hyperlinks will be provided, if the address location changes it may require the user to search online for the TIGER/Line data from the census bureau. Goto: https://www.census.gov/geo/maps-data/data/tiger.html a portion of the website has been copied in Figure 1. The top arrow is pointing to the method which will be used to download shapefiles. The lower arrow is pointing to the method to download information as a geodatabase, either method may be used. In general when downloading the information in a geodatabase more data is provided for a larger geographical region such as an entire state as opposed to census tracts for a single county. If the statewide data is downloaded the appropriate information can be queried for the required information extraction.
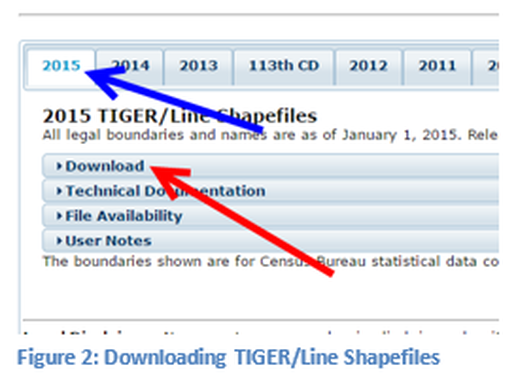
The census bureau also has several informational documents that can assist in understanding how to use the data. Select the shapefile download links shown in Figure 2. First select the year to be downloaded, in general, it should be the most current year available. Then select Download which will ask if the web interface or the ftp site will be used, select the web interface. This will open a new web page, and it can take a few minutes before all the information is loaded in the second drop down box. The drop down box gives the user the ability to select the appropriate geography for the download. The year can also be chosen but this can be ignored since it was previously selected. In the drop down box select Census Tracts and select submit. On the next page select the state. For our example Kentucky will be used. Then select download, all the census tracts for the state of Kentucky will be downloaded, in past versions of the website the user could select individual counties, but this has been eliminated. Once the data has been downloaded and decompressed the user can query the individual county for the study area and can save that information as a new shapefile.
Instead, if the user selects the hyperlink to download the geodatabase as seen in figure 2, the following steps are required. First the year must be selected as before and then the specific geodatabase is selected through a pull down window. Select the state of Kentucky and click GO. The geodatabase will be downloaded as a compressed file and will require that the user extract the database before reviewing in Esri ArcMap.
Downloading Tabular Data from the U.S. Census Bureau
The process for tabular data download will be demonstrated in this section for data at the census tract level. This process can also be used for data sets at other levels (note not all data is collected at all levels). The process of downloading tabular data is a three step process. The first step is identifying the geography for the data, this includes both defining the location which can include multiple counties, but also the type of political divisions such as census tracts or congressional districts. The second component of the process is to locate the tabular data needed, such as median age or educational attainment, it is suggested that each parameter be downloaded independently, but they could be downloaded as a single table. The third component is the actual downloading of the data which can be done in different formats.
For this example, Jefferson County in Kentucky will be the geography at the census tract level. The table to be downloaded will be median income. For our case the downloaded data will be stored in a CSV file format.
For this example, Jefferson County in Kentucky will be the geography at the census tract level. The table to be downloaded will be median income. For our case the downloaded data will be stored in a CSV file format.
Geography
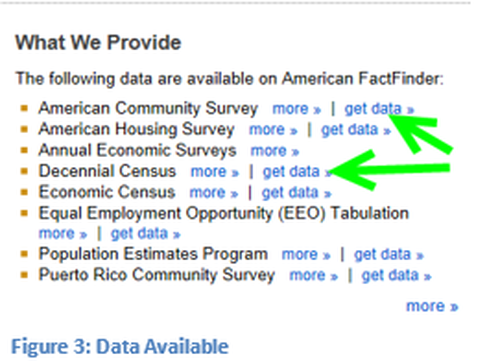
The American FactFinder is located at: http://factfinder.census.gov/faces/nav/jsf/pages/index.xhtml from this page the data stores can be accessed for the American Community Survey (ACS). Near the bottom of the page is a set of hyperlinks to different data sources. The green arrows in figure 3, point to the Decennial Census dataset and the American Community Survey data. For this lesson the ACS data will be used. If the learner has problems linking to that site, the direct link for ACS is: http://factfinder.census.gov/faces/nav/jsf/pages/searchresults.xhtml?refresh=t.
|
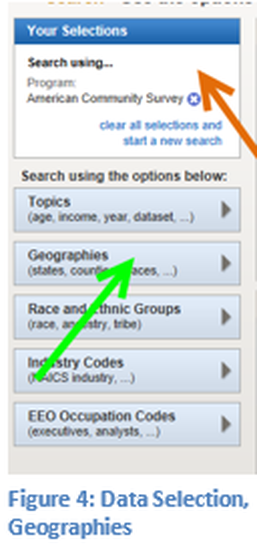
In Figure 4, a small portion of that page has been clipped to show the choices and the initial conditions. In the top box the parameters that have been selected are displayed, initially only the American Community Survey is selected. Note: the blue circle with an x showing that items can be deleted as needed.
The first process that will be completed is to select the geography of the study area. In selecting the geography, the user determines which region is chosen. Click the Geographies button to open a new window as seen in Figure 5.
|
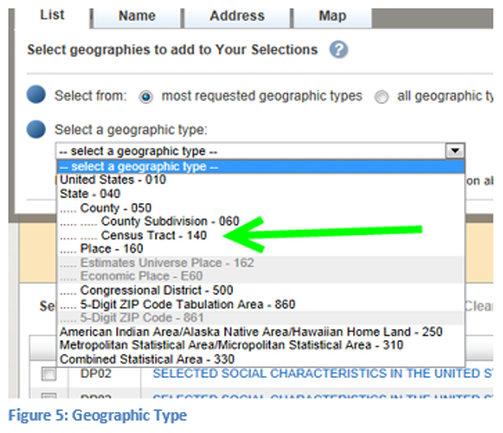
The window in Figure 5 will open and the pull down has been selected. Note: the different geographies that can be selected. For this example the Census Tract level (140) will be selected. Click on that item to specify the type of geography that will be used in the tabular data set. The next several figures show how to select the geographic region.
|
|
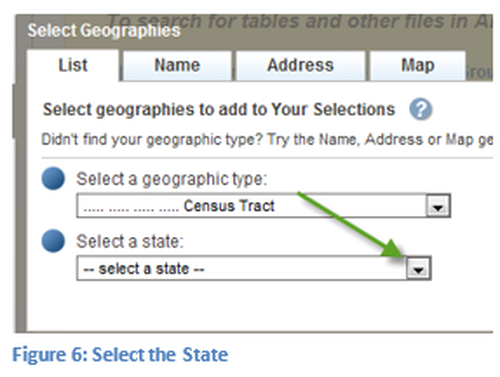
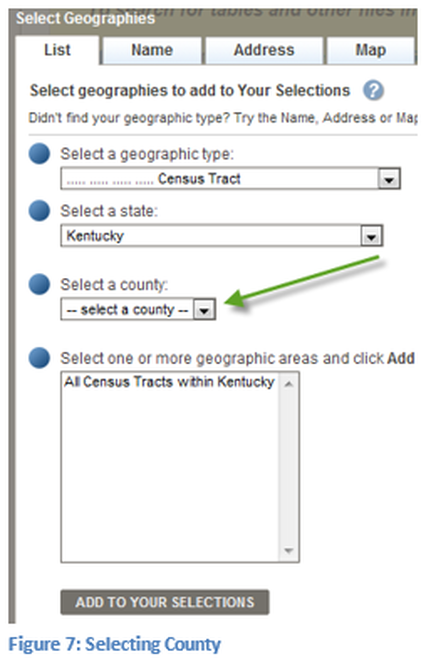
The next parameter that must be selected is the state, for this example we are using a county in Kentucky, and therefore Kentucky is selected on the form from the list as can be seen in Figure 6. The window will change slightly and the learner can either select the census tracts for the entire state or select an individual county. For our example we will select an individual county by using the pull down, and locate Jefferson County. Any county maybe selected as long as at least 10 census tracts are contained in the county. Jefferson has a large population and is not suggested for the first time user doing this process. |
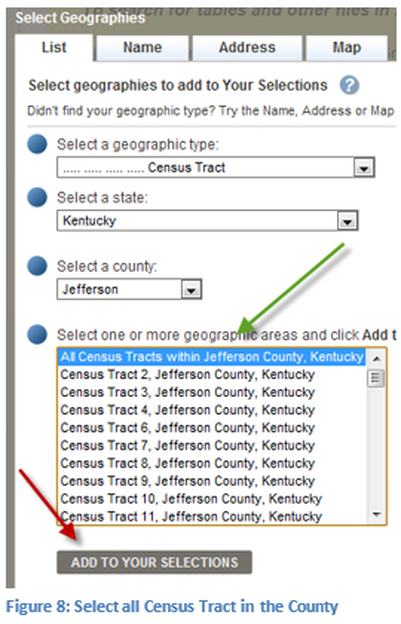
Once the county is selected the user has the choice of selecting individual census tracts or selecting all the census tracts within the county. For this example all the census tracts have been selected. Once the county has been chosen it can be added to the geography list. At this point only a single county for our work has been selected. Additional geographies, counties, can be added to the research area by repeating the process. For this example no additional geography will be added. In the next step the tabular data will be selected. Close the geography window, which is on the upper right side.
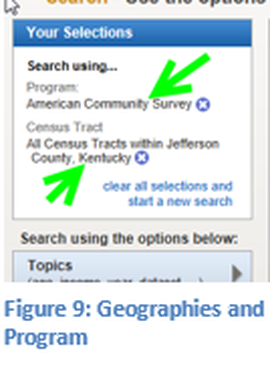
In the upper left corner notice that the geography of census tracts in Jefferson County Kentucky have been added, see Figure 9
Data Selection
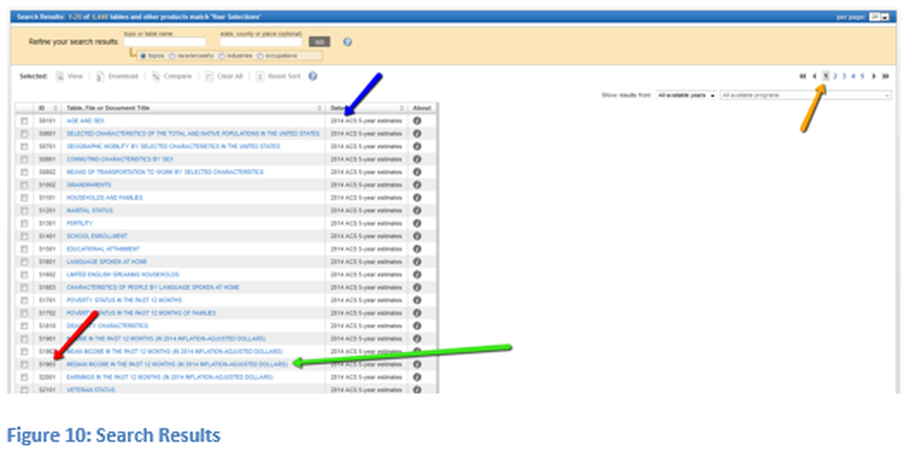
There are multiple screens of data which can be selected. For this particular geography there are thousands of tables. In this example the data set S1903, Median Income will be selected for the most current ACS data. The source of the dataset is listed in the next to last column on the right, additional information about the data set can be obtained by clicking on the information button in the last column on the right. Check the box on this screen and the downloading can be completed, it is recommended that the learner click on the file description (green arrow) to look at the data and select the type of download to be used. If download is selected on the page in Figure 10, the user has no control over how the download will be configured. After clicking on the description of the file a window like Figure 11 should appear.
For each Census Tract the type of data collected is visible, there are multiple pages of data. Once the data has been inspected it is ready to be downloaded.
For each Census Tract the type of data collected is visible, there are multiple pages of data. Once the data has been inspected it is ready to be downloaded.
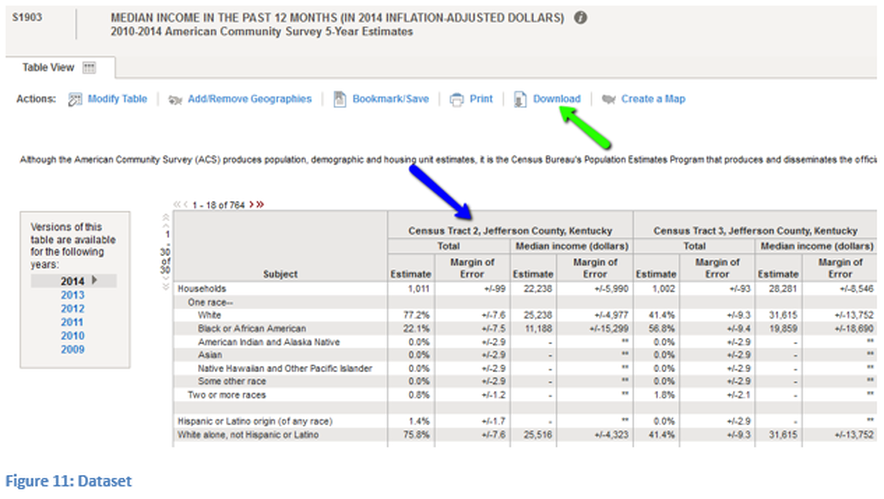
Click on the download button (green arrow).
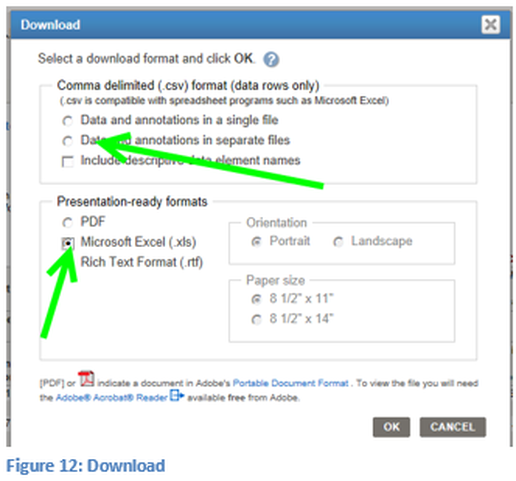
Download the data in a comma delimited file (.csv format) to do this click on the second radio circle. If you select Microsoft Excel, as done in the past, you will get a spreadsheet that has issues when attempting to do a tabular join with Esri ArcMap.
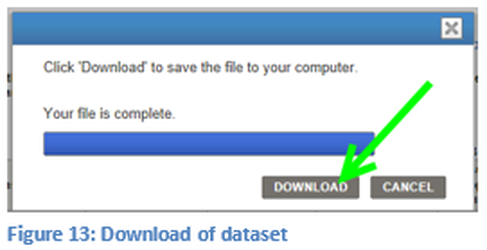
Building the tabular data file can take a few minutes depending on the amount of information being requested. This is dependent on both the number of census tracts and the amount of data per tract. Once the tabular data file has been created it must be accepted for the download to occur. In general the data will be placed in the download folder. Note: on the user’s computer the file name will be generic so if you have multiple downloads this could become an issue.
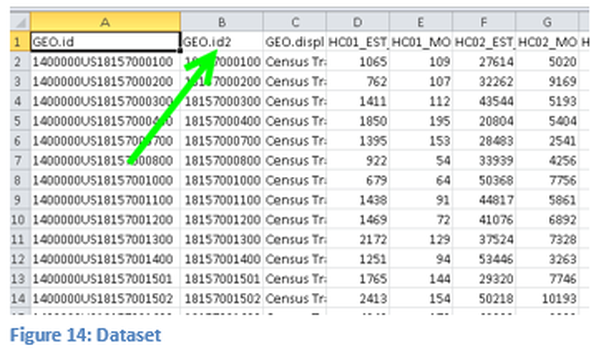
The tabular data file will be in a compressed format. Therefore the user must decompress the data before it can be used. Open the tabular data file in Microsoft Excel, because viewing it as a text file makes it difficult to modify. In the Tabular Joining Technical Skills Lesson the process of actually joining the Census Tract polygon shapefile with the Census Tract tabular data will be discussed. Each row in the data set represents a different census tract and each column represents either a control attribute or a data attribute. To successfully use this data any special characters must be removed from the first row, since this row will be the header for the data. Also there can be only one header row and if the data has a two row header the second row must be removed. It is suggested that the modified file be given a new more descriptive name and that the folder name reflect both the data and the geography. This file, in general, is used only in the joining process to a shapefile and thus it is not an item that is directly referenced once that process has been completed.

