Data
The following shapefiles can be used for this lesson, but the user can also select similar files if they would like. Note each of these files will need to decompress (unzip) before the shapefiles can be utilized with Esri ArcMap Desktop.
U.S. Counties http://techcenter.jefferson.kctcs.edu/gis/data/Country/USA/USA.html this file is called County Boundaries.
U.S. States http://techcenter.jefferson.kctcs.edu/gis/data/Country/USA/USA.html this file is call State Boundaries
U.S. Metro http://techcenter.jefferson.kctcs.edu/gis/data/Country/USA/USA.html this file is called Metro Areas
Kentucky Zip Codes http://techcenter.jefferson.kctcs.edu/gis/data/Country/USA/State/State.html click on “K” and then Kentucky to locate the file.
Ky. Shelby Co. Elevation http://techcenter.jefferson.kctcs.edu/gis/data/Country/USA/State/State.html click on “K” for Kentucky, then click on Kentucky, followed by clicking on County, next click on “S” for Shelby County and finally Shelby County to see the file to download called Elevation.
U.S. Mills http://techcenter.jefferson.kctcs.edu/gis/data/Country/USA/USA.html this file is called Mills
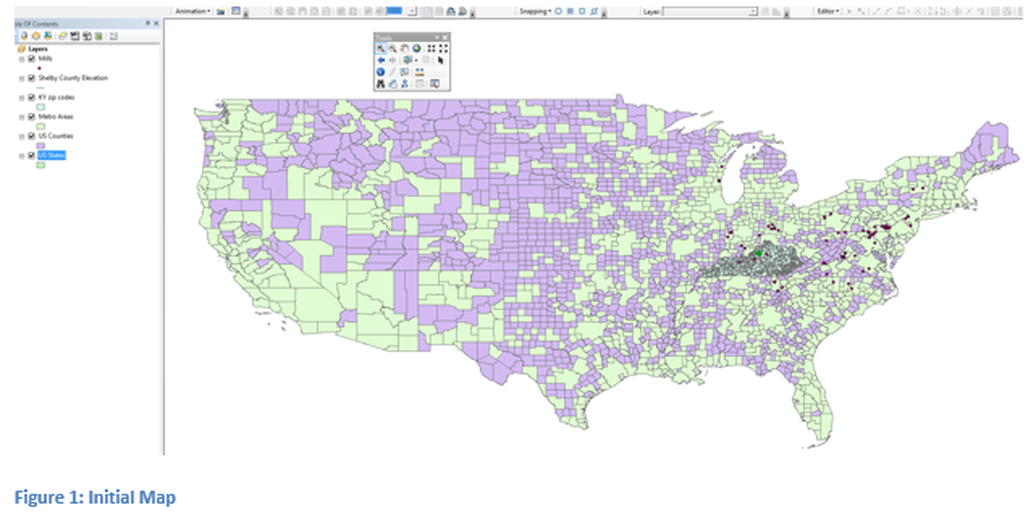
Load all shapefiles listed above onto a map, the results should be similar to what is displayed in Figure 1. The six shapefiles are all being displayed at the same time, which makes it difficult to understand anything about the map. These layers include: state boundaries, county boundaries, zip codes for Kentucky, metropolitan areas, Shelby Co., KY elevation data, and the location of selected grist mills. There are point files, line files and polygon files as part of the display information. There is too much data projected at this zoom level to make any sense of what is being displayed. This lesson will develop the concepts of automatically making different datasets visible at different scale ranges. The lesson will also present different ways to display the data through colors and symbology. The colors on the map are shown as the default colors and they may vary on different computers.
Process