Editor
For example on a tree map, it is a set of points, with each point representation a tree. Each tree has specific features that can be recorded such as type of tree, health, height, width and comments. When the field research was done the position of the trees was determined with a GPS and hand written notes were taken. The researcher wishes to add the notes to the position of each tree, the editor would be used to complete this task. In reviewing of the map it was determined that some trees were slightly miss positioned due to building interference, they can be moved using the editor. Since several people took data, a few trees locations were taken by more than one field team. The duplicate information can be removed using the editor.
Another example of using the editor: In researching of a region, a historical map from 1920 is used to locate who owned different parcels of land. The map has been georeferenced to the particular township (not a technical skill of this class). The researcher must manually plot the land sections onto the map. The editor is used to plot the shapes, as polygons. One polygon must join directly to another and thus the snapping feature was used for the joining of polygons. Each polygon will be a different row in the attribute table. The owner of the parcel is also manually added once the polygon has been completed. Upon inspection it is determined that a few of the vertexes do not properly align, they are corrected in the editor by moving vertex location and use of the snapping tool.
Load the three layers onto the mapping surface, one layer should be a point file, one a line and one a polygon. For this example a raster image will be loaded onto the map. Each item in a shapefile on the map will be a row in the attribute table.
|
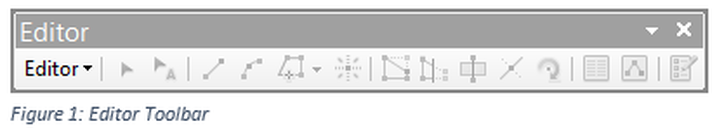
To get started the Editor Toolbar needs to be opened within Esri ArcMap Desktop. This is not the same features as what is contained in the Editing
|
Tools in the Toolbox. In this example, work will be done entirely with the Editor Toolbar and the menus associated with it. The Editor Toolbar can be located under the Customize menu under toolbar. The Editor Toolbar has lots of properties and only some of those properties will be discussed in this technical skills lesson. In addition the Snapping Toolbar will also be used in this lesson and is located at the same location as the Editor Toolbar.
To start using the editor, there must be an existing layer (shapefile) that can be edited. When in the editor, data modifications are not
To start using the editor, there must be an existing layer (shapefile) that can be edited. When in the editor, data modifications are not
automatically saved, but only saved when the information is manually saved, which is accomplished under the Editor Button. When stopping an editing session the user is prompted if they want to save data that has been constructed or modified. The file can be an empty file initially.
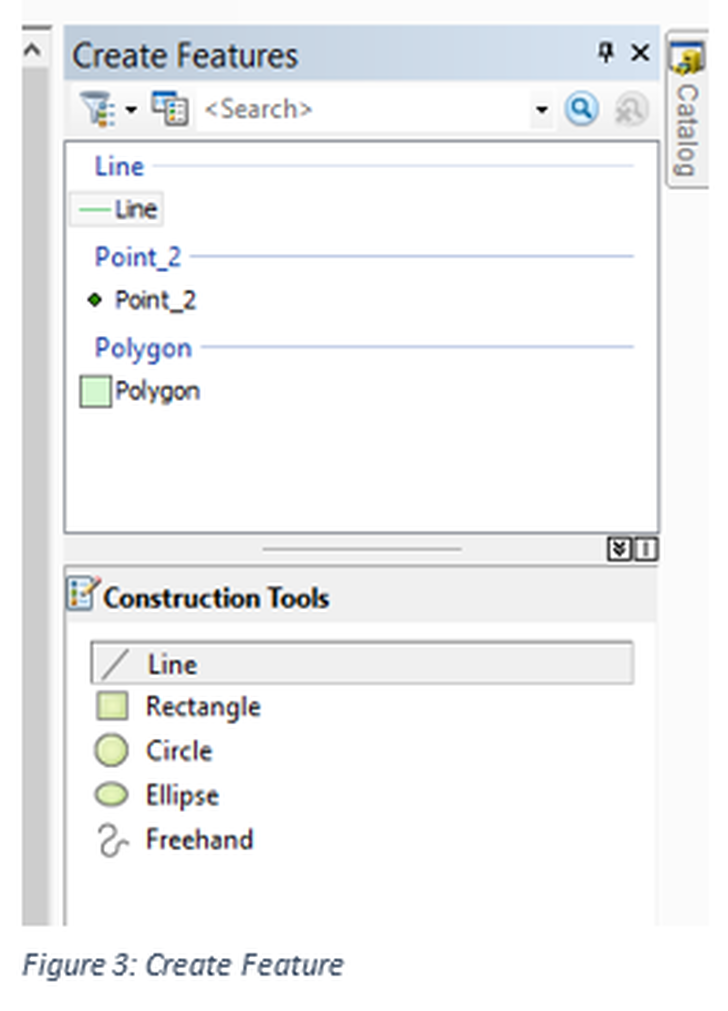
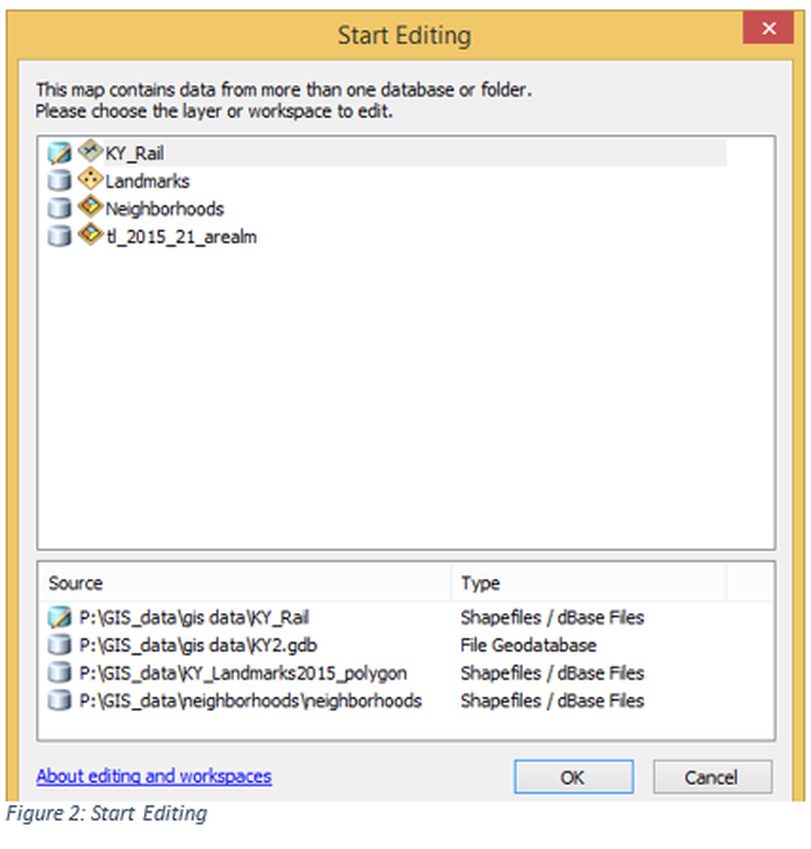
Use the Editor Button and select Start Editor. Note in Figure 2, this is from a different data set since all files for this exercise are in the same geodatabase and did not require this dialogue window, if this window appears click on the layer and then OK. Once the Editor is started features that are grayed out will become active. All layers saved at the same location, such as the same geodatabase can be edited together. If they are in different storage locations which is not recommended, the editing session of one layer must be stopped and the other started to change layers being edited.. The Create Feature window should open, see Figure 3, if does not open it is the last button on the right side of the Editor Toolbar shown in Figure 1. In some cases an intermediate window may open click OK to continue. In Figure 3, a line service is selected and under construction tools line was selected. Map services cannot be edited with the editor, but feature class service can be edited, no services will be edited in this course. Note: The editor can also be started by right clicking on a shapefile in the Table of Contents; the functionality will be the same.
Editing the Attribute Table
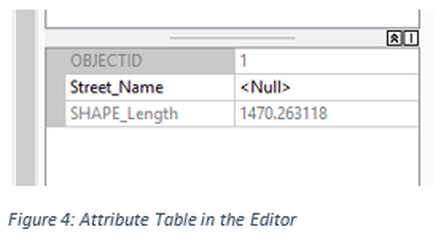
Open an attribute table as done previously or use the third button from the right end of the Editor Toolbar, this will open a modified attribute table designed specifically for editing of attributes, see Figure 4. In figure 4 the attribute table for the line file previously selected is displayed, note there are blank fields (Street_Name). The fields names are in the first column and the attribute of the selected segment is shown in the second column. A new blank field (attribute) has been created, using the full attribute table, with the editor turned off, for assistance in creating a new field see the technical skills lesson on calculating data in which new field construction is discussed. The layer us already populated with information. For this example a line shapefile will be used, this shapefile represents the campus road on the Southwest Campus of Jefferson Community and Technical College. Use the selection tool to select the campus road, this should make visible that line segment. Place a name in the new field (Community College Drive), repeat the process for all line segments. The basemap has not been georeferenced and therefore cannot be placed onto the earth’s grid. A similar process can be done with points or polygon shapefiles. Once the process has been completed to add the attributes to the road, the shapefile must be saved and the editor stopped.
Moving a Point
In this process use the point shapefile in the previous part of the lesson. Turn the editor on and select the point shapefile to be edited. Use the selector arrow to select a point on the map, the selector arrow is the first button to the right of the Editor Button. Click and hold the selected point and move it to the proper location. Once the object has been moved it is suggested that a save be done before moving another item. When the editing is complete save and stop the editor.
Snapping
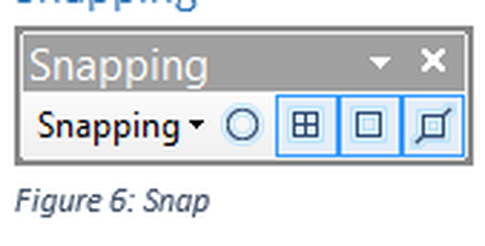
The Snapping function is located off of the Editor Button pull down menu and has a toolbar when selected. Snapping allows the user the ability to insure connections between objects. In general the author leaves all snaps functions turned on for all construction projects. This is a critical function because at some zoom levels one line, for example, might appear connected to another, but as a tighter zoom is used they will be shown as not connected, snap allows the user to make accurate connections. There are four major types of snaps: Snapping to a point, which is useful when connecting a line to a point shapefile, Snapping to the end point of a segment, which is used when starting a new segment, Snapping to a vertex, to make sure that one segment is connected to another segment when they don’t connect at an end point, and Snapping to an edge. For example, when a long straight line is present and a new segment is generated off of this line such as a side road. Snapping in general is used for line and polygon files.
Edit a Vertex
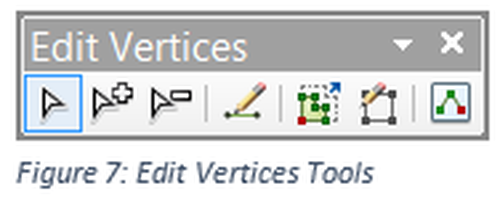
The moving of a vertex is used for both line and polygon shapefiles. The moving of a vertex is used when it is discovered that a line segment is not in the proper location. In general it is not the entire line that is in the wrong position but a part of the line, to correct the issue one or more vertices must be move to properly align the segment. Use the selector arrow, first select the line, which will highlight the line segment and right click to select the edit vertices toolbar as shown in Figure 7. This toolbar can also be loaded from the customize menu. The first button is the same selector arrow as discussed previously. If the user has a query running it must be removed prior to starting the editing of a vertex, if more than one item is selected, i.e. more than one line is highlighted, a small window with a pull down arrow will appear and the user must select the layer to be modified. This is independent of the layer that was selected as the editable layer when starting the editor. Click on a vertex and hold and drag the vertex to the proper position. Many times these errors are caused when snapping was turned on, or the designer position shifted (i.e. the mouse moved) as the position was being selected.
At other times the solution to the problem is the adding a vertex. For example, a road has a curved path, but all curves are composed of straight line segments. The original creator did not put enough segments in the curve for the resolution in which the data is being displayed, the designer needs to add additional vertices for the project. Select the line and edit vertices as previously discussed, using the second button on the Edit Vertices toolbar click on the line between two existing vertices to add a new vertex, than drag the vertex to the proper location. The key is to make sure that the insertion point is between the proper two vertices.
Using the third tool on the toolbar, a vertex may be deleted, click this button and then select the vertex to be eliminated. Remember if working with a point shapefile, there are no vertices since they are all single elements.
Using the third tool on the toolbar, a vertex may be deleted, click this button and then select the vertex to be eliminated. Remember if working with a point shapefile, there are no vertices since they are all single elements.
Manually Adding a Data Point
Start the editor, and in the Create Feature window, see Figure 3, which can be opened by selecting the last button on the Editor Toolbar. Click on the Shapefile to highlight and then click on the point construction tool. Move the cursor onto the map and click the location where the new data point will be added. Next go to the attribute table and select the appropriate information for the new data point. For this example several light standards will be added to the map, click the location for the new light standard, give it the proper ID number, return to the map and select the location of the next light standard and click and repeat the process until all light standards have been added to the shapefile.
Adding a Line Segment
To add a line segment, the snapping tool will be used so that new segment connects exactly onto the end of the previous segment. Thus the snapping tool will insure that the end vertex and first vertex on the new segment have the exact same position. Start the editor as before but select the campus road shapefile. For this example snap to the end of the previous segment and click every place that a new vertex should be placed. When completed with the line segment, double click to finish the segment. The last vertex should be red, while all other vertices are displayed in green. Complete the attribute table properties. The line segment could start at any location and does not have to be connected to an existing segment, such as the runway for an airport. If starting a completely independent segment use the line button on the Editor Toolbar, see Figure 1 (the fourth button to the right).
Adding a Polygon
The addition of a polygon structure is similar to the adding of a line segment except the final vertex is used to close the figure. The polygon figure does not have to be contiguous to an existing polygon or vertex, but if the map requires such a structure the snapping tools can be used as described previously. For this example each of the buildings should be mapped as closed features, complete the map by creating multiple polygons one or more for each building. Note: on some of the more complex structures multiple polygons can be used, or each building can be an independent polygon. Polygons can be merged together, but will not be discussed in this lesson. If the polygons are constructed as independent structures snapping is not required. One or more polygons should be used for each building, complete the attribute table by naming each of the buildings.
Additional Tools
There are numerous other tools which can be used, such as making sure that one line is either perpendicular to another or parallel, a very useful function when working with parcels and buildings. Locating the midpoint of a line segment and thus being able to create from that location. For example, in surveying a section contains 640 acres, but historically they are subdivided into 16, 40 acres pieces of land. Therefore, using the midpoint of a section line can be used to do the division. Splitting of a line or a polygon into two parts can also be accomplished with the Editor. Note also on the Editor Toolbar that the sixth button (the default is the midpoint tool) from the right has a pull down arrow, using this pull down provides additional options. One of these options is a tool for tracing. This tool is very useful if a complex surface or line exists and is needed in another shapefile. For example many county borders are defined in part by the locations of rivers and streams. To be able to trace the river for another map can be extremely useful, when using the tracing tool this can be an extremely slow process.

