Part 2
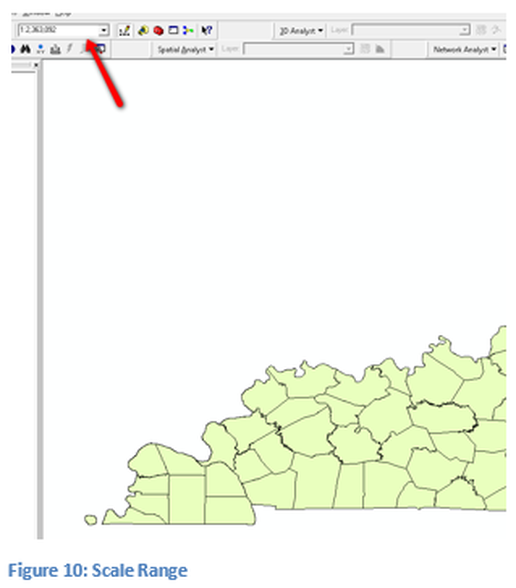
In this part of the lesson, scale range and class creation will be discussed. The scale range of the map is visible in Figure 10, the red arrow is pointing to the scale of the map. The scale is what is used to determine the zoom level of the labels. For this example the county names are to appear at a 1:1500000 level and disappear at 1:250000. Note commas have not been placed in the numerical values, since they cannot be placed in the scale windows, but they will appear with commas when displayed. The county names should be black in color and appear only within the county boundaries. All the labeling features were discussed in part one of the lesson, except the creation of the dynamic zoom. Create the required features before setting up the zoom levels. Make sure that Label Features for this layer is checked. Select the field which will be used for the label and format it, such as color, font, and size. Make sure the size of the font is large enough to be visible but does not dominate the feature. Determine and select the placement of the label. The turning off and on of the label based on zoom level will be accomplished. The scale window will be used to set the automatic zooming levels. In setting zooming levels there are two criteria when a feature turns on and when it turns off, both are not used for every application, for example the label can be turned on at a certain level, but never turned off.
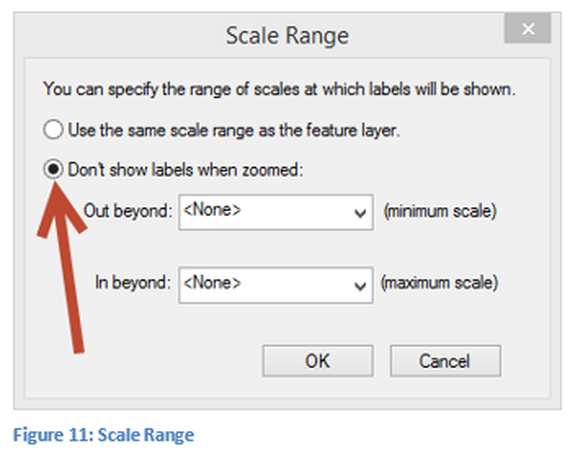
Click on the Scale Range button shown in Figure 11. Do not put commas with the numerical value only the range, i.e. 1500000. The software will automatically add the commas. Select the second parameter as seen in Figure 12. Using the minimum scale pull down select one of the preprogrammed values or the current zoom level, repeat for the maximum scale. It is important to read the entire line to fully understand what is occurring. Sometimes the terms minimum and maximum scale are confusing as they are used in this operation.
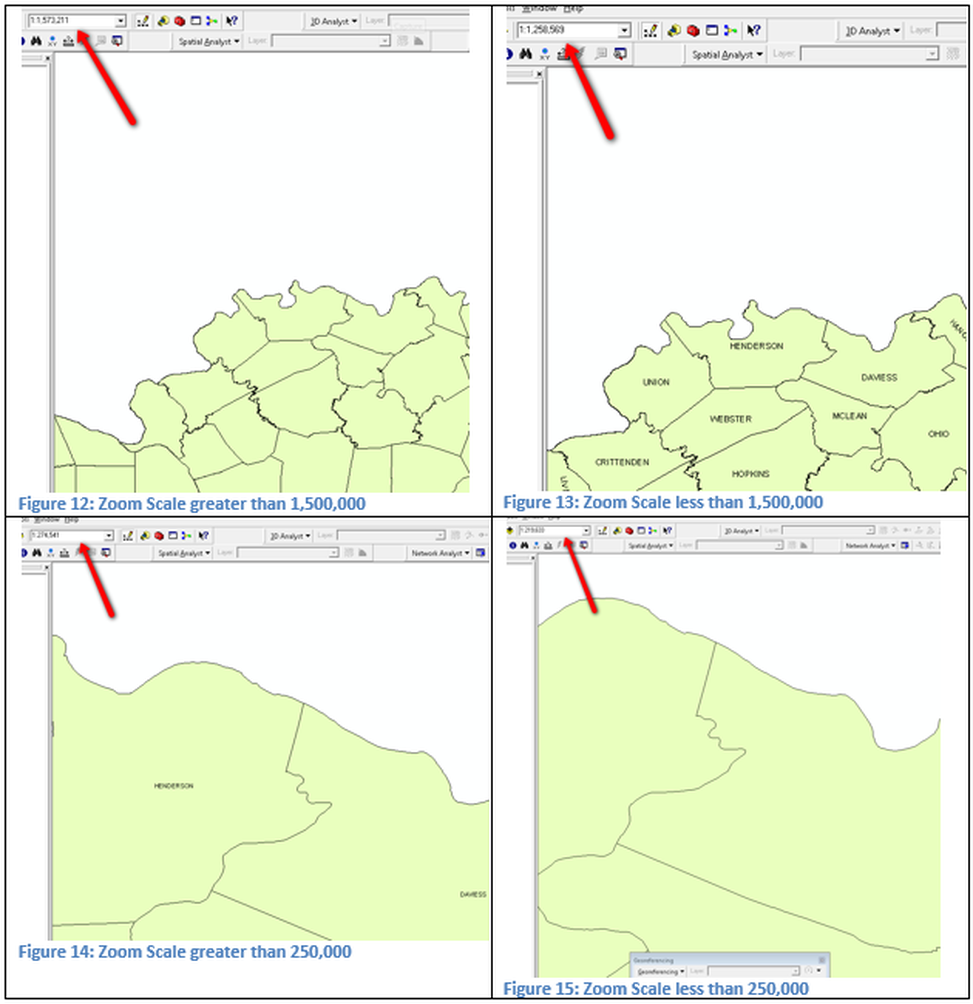
Don’t show labels when zoomed Out beyond 1,500,000 (minimum scale). Minimum scale means that the labeling will turn on when the zoom ratio is less or equal to 1:1,500,000. Don’t show label when zoomed in beyond 250,000 (maximum scale). Maximum scale means the label will turn off when the zoom ratio is less than 1:250,000. Therefore, if the zoom ratio is greater than 1:1,500,000 the label would not be displayed and if less than 1:250,000 the label would not be visible, or these parameters could be stated that label is visible when the scale zoom ratio is between 1:1,500,000 and 1:250,000. The next four figures show the results of the zoom levels.
The techniques discussed above can be used with the other layers that were initially loaded. Each individual layer is labeled independently. Label lakes and rivers in blue, when approximately 3 or 4 counties are visible, do not turn off the label as the user zooms in closer. Label zip codes when 1/3 of the state is visible, do not turn off these labels. The designer may also want to include auto zoom to turn on and off layers but that is not a requirement of this lesson and is part of a different technical skill lesson.
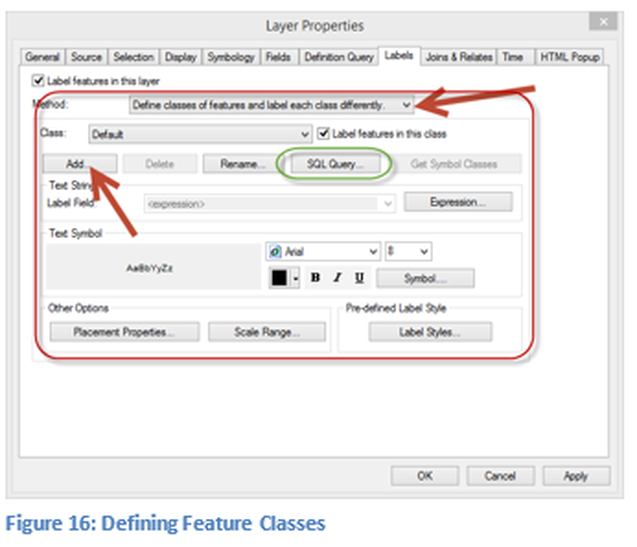
Another feature that can be controlled is using more than one field to label a feature. In the first part of this lesson, both the name of the county and the population of the county were combined together using the expression button. The pull down below the label features check box has two potential selections. To this point the default selection was used. Select the other feature which is the: Define classes of features and label each class differently. This labeling function allows all the controls that were done for a single feature or expression can be done for each field or combination of fields. Select Add and provide the name population. Use the pull down arrow to select the field to label, select the 1980 Population Field. Select a different font face and color for this layer. Placement properties and scale range can also be selected for this class. Another parameter that is shown in Figure 16 in the green box is that query statement could also be written for the layer. For example, only label those counties with a population value that is less than or equal to 20,000 would be displayed.
The result of defining different classes might be the county name turns on and off at the same levels as previously discussed. The population is shown in red and turns on when the zoom is 1:1,000,000 and turns off at the same level as the county name.
The result of defining different classes might be the county name turns on and off at the same levels as previously discussed. The population is shown in red and turns on when the zoom is 1:1,000,000 and turns off at the same level as the county name.

