Software
There are many different software packages that can be used in geospatial technologies. These software solutions will provide various tools, while the concepts are the same, the methodologies will be different. It is important to understand the concepts so that if unfamiliar software is used at a place of employment, only the methods will need to be learned. There are numerous types of open source software that are powerful in the creation of digital maps, one to consider would be QGIS. For this introductory class Esri ArcGis Desktop will be utilized. There are different versions of this software and while most versions of ArcGis Desktop will work, for this course the lessons are based on version 10.3 and higher.
Esri ArcGis Desktop
ArcGis Desktop is a suite of several applications, such as ArcMap, ArcCatalog and ArcGlobe. There are multiple versions available and any of them can be used in this course. The concepts between the different versions will be the same, however the actual look of the screen and how the processes are accomplished may be slightly different. One of the most used applications in the ArcGis Desktop suite is ArcMap. It will be used in a Microsoft Windows environment and is not available for Apple OS. ArcMap will be used extensively in this course.
Preferably students should have access to Esri ArcGis Desktop to complete lessons and all required components for this class. For those enrolled in the class or workshop please contact the instructor to gain access to the software. If not enrolled in a formal component of this class the user will need to gain access to the software. Open source software can also be used, the concepts will be the same but the methods will be different.
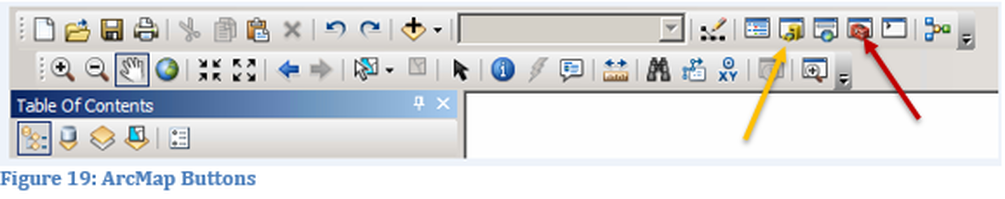
Many of the buttons and menus in Arc Map have a standard appearance that resembles other software interfaces. Two of the geospatial programs that can be launched from within ArcMap are Toolbox and ArcCatalog. ArcCatalog is represented by the yellow file cabinet icon and Toolbox by the red toolbox icon, as seen in Figure 19. ArcCatalog is also a standalone program that can be accessed outside of ArcMap, but Toolbox must be accessed within either ArcMap or ArcCatalog. The Toolbox is used for most of the geoprocessing operations. Geoprocessing operations can also be accomplished using Python script, but that is beyond the scope of this course.
Preferably students should have access to Esri ArcGis Desktop to complete lessons and all required components for this class. For those enrolled in the class or workshop please contact the instructor to gain access to the software. If not enrolled in a formal component of this class the user will need to gain access to the software. Open source software can also be used, the concepts will be the same but the methods will be different.
Many of the buttons and menus in Arc Map have a standard appearance that resembles other software interfaces. Two of the geospatial programs that can be launched from within ArcMap are Toolbox and ArcCatalog. ArcCatalog is represented by the yellow file cabinet icon and Toolbox by the red toolbox icon, as seen in Figure 19. ArcCatalog is also a standalone program that can be accessed outside of ArcMap, but Toolbox must be accessed within either ArcMap or ArcCatalog. The Toolbox is used for most of the geoprocessing operations. Geoprocessing operations can also be accomplished using Python script, but that is beyond the scope of this course.
Basic Map Data
There are two major file types normally placed on a map, shapefiles (vectors) and rasters (bitmaps). Data is placed on a map in layers. A layer is like stacking pieces of transparent plastic on top of one another. Therefore, if what is drawn on the plastic is opaque it will block anything on other plastic sheets placed below. If the layer is a line or data point other information can still be observed in the lower layers unless directly below objects in the layer above. If the layer is an aerial photograph nothing below the photograph will be seen. Layers can be made semi-transparent so that you can see through them. Ordering of layers is a critical step in good map construction.
A shapefile is a vector representation of spatial information. A shapefile is not just a file but requires multiple files that must stored be in the same file folder or database to operate properly. When data is shared the entire folder or database must be shared, the best way to share data is in a compressed or zipped file. As will be noted later in this module, once data is placed into a file structure it should not be moved since this will affect the ability to display the data appropriately. Specialized databases are used in mapping, they are referred to as geodatabases. In Microsoft Windows a geodatabase appears as a file folder in Window Explorer. The geodatabase may require compressing to easily transfer to another computer, depending on the method used. A geodatabase generally will contain all the files used in one or more projects. A geodatabase is the recommended storage method over an individual shapefile in a folder. The best way to work on data is in a cloud based geodatabase array. Cloud based storage may need to be localized on a storage array behind an organizations firewall. Some Cloud based services are not recognized directly within ArcMap Desktop. Some compatability issues will depend on how the Cloud storage is configured on a local desktop and accessed. In general if a drive letter can be assigned it can be used.
There are three types of shapefiles which will be used point, line and polygon. A shapefile is a vector, thus pixilation is typically not an issue. The other major type of file is an image or raster file. A shapefile is composed of multiple lengths with direction and initial location, except for a point shapefile. When a line or polygon shapfile is zoomed tightly into a small area the lines might look as straight line segments and no longer a curve.
In Figure 20, three shapefiles and a small portion of a map are shown. The check box to the left of the shapefile name, in the Table of Contents, signifies if the shapefile is visible. In this example all three shapefiles are selected and are visible on the map. The first shapefile for hospitals is easy to understand and is represented as a point file using the appropriate symbol. The next shapefile in the table is the county boundaries file. The name used for this shapefile is not easy to understand and should be renamed. The third shapefile is the state boundaries file while the name is more descriptive than the county boundaries it should also be renamed. The last two files are polygons, the first file was a point file. All three layers are active and visible on the map. If a layer is removed from theTable of Contents (right click), it is only removed from the project and not from the storage location.
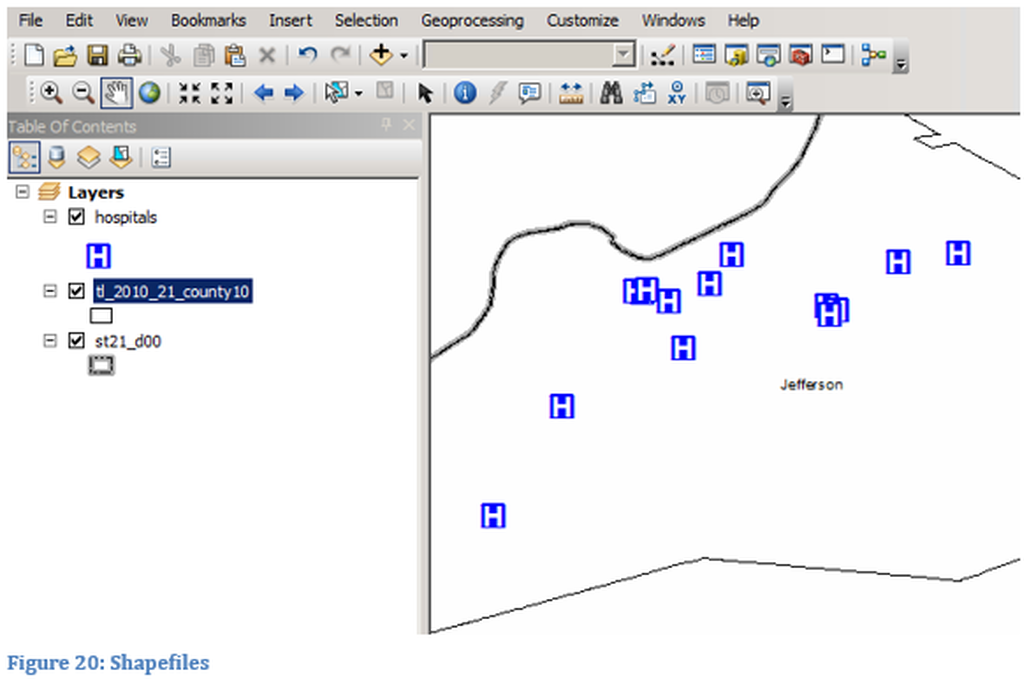
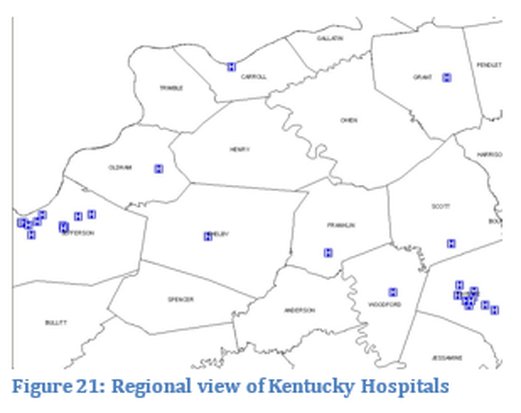
In a point shapefile, locations are represented by a single point. A point has no physical size, but has a projected size on a map. The map designer determines the size, color and symbol of the point shapefile for the project. Generally point shapefiles are the top layers on a map and thus first in the map Table of Contents, see figures 20-21. Types of point data might include buildings, towns, cemeteries or any other objects that can be represented as a single location. For example, if a demographical research of students was being mapped in a project, the residence of the students would be represented as a point. Points might also be used for cities on a national level map, but on a county map they might be represented by a polygon shapefile showing the actual city boundaries.
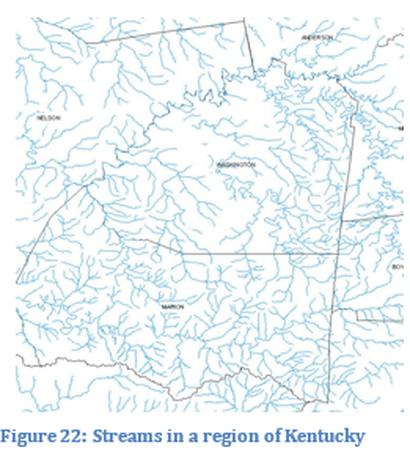
Line shapefiles represent objects in which the actual width is not specified and is not a closed object (polygon), as seen in Figure 22. By definition a line will have a length and a direction but no width. A curved shaped line is a series of straight line segments, each segment has a starting position, length and angular measure, together they compose the shapefile. Roads, railroads and streams are some of the more common types of line shapefiles. When looking at a detailed view, a line shapefile might not be the appropriate type of shapefile to use because the width is not a component. For example, the Ohio River would be drawn as a line on a national map, but drawn as a polygon on a regional map to show the width of the river at different locations. Parameters which can be controlled are color, line weight (width) and style (solid, dashed, etc.). Line shapefiles are usually placed below points on a map.
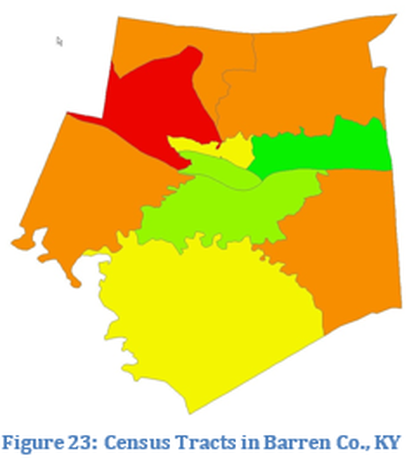
A Polygon shapefile represents any closed object. All closed objects can be filled to become opaque objects, as seen in Figure 23. The boundary of a polygon is a line, thus all the line properties discussed previously are part of the shapefile. A second parameter is the fill property. A polygon can be filled with a solid or semitransparent color or pattern. A polygon shapefile can also have a hollow fill (transparent) and thus it uses only the components of a line. Polygons can represent objects such as national, state, county and city boundaries. Zip Code areas, Census blocks and tracts are also represented as polygons. Roads, rivers, streams, lakes and buildings can also be represented with a polygon. When you fill an object with an opaque color the data layers below it cannot be seen, therefore this layer is usually one of the lower layers on a map.
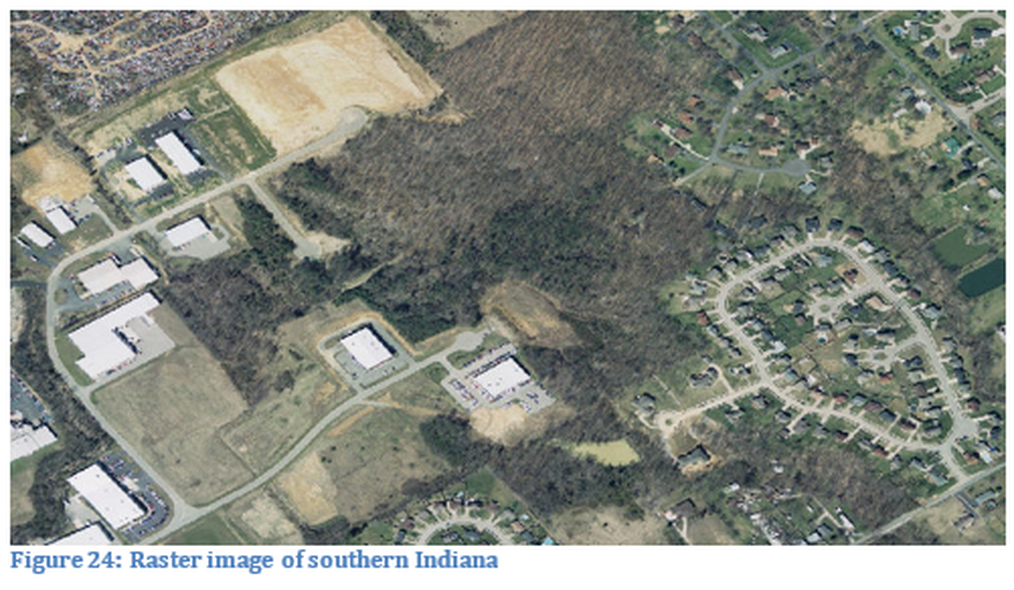
A raster is an image (picture), such as an aerial photograph, satellite image or a scanned/digitized map. Raster images are not shapefiles. A raster image can be thought of as being composed of a series of dots arranged in rows and columns, a dot matrix. Images can be stored in several different formats. Each picture element on a camera corresponds to a single dot in the image. The more elements on the CCD chip the sharper the resolution and the more detail represented by a single pixel. A raster image has a maximum zoom level which can be used, since beyond the this level individual dots are displayed. The image is usually composed of three color bands for each pixel (dot), in some applications the pixel might have more bands. Individual bands can be used in analysis such as in remote sensing classification of land usage. Raster images are usually put at the lowest level on a map since, in general, they are opaque but they can be semitransparent. The images must be projected just as with shapefiles.
All the layers in a map generally follow the order of point shapefiles as the highest level, followed by lines, polygons and raster images. Some of the variations of this rule might be a polygon shapefile which has a hollow fill and thus acts like a line shapefile. Another variation might be a raster as a semitransparent value placed on top of data, so that ground features are shown on top of data to develop a better sense of place.
All the layers in a map generally follow the order of point shapefiles as the highest level, followed by lines, polygons and raster images. Some of the variations of this rule might be a polygon shapefile which has a hollow fill and thus acts like a line shapefile. Another variation might be a raster as a semitransparent value placed on top of data, so that ground features are shown on top of data to develop a better sense of place.

