Part 1
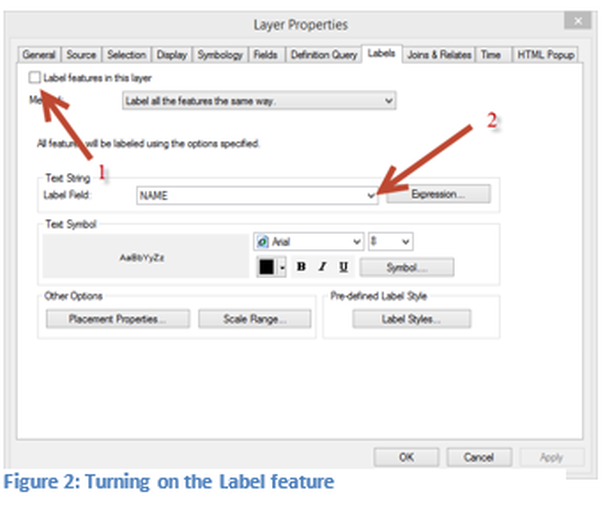
In Part 1 of this technical skills lesson the emphasis will be on labeling features for a static map. Open the properties window for the layer and navigate to the Labels tab. To label any feature, the Label features box must be checked (arrow 1). Once this box is checked labels will appear for the selected layer on the map. An attribute must be selected for the label field using the pull down, pointed out by arrow 2. Exit the properties window and make sure the counties are properly named. There may be a few counties without names shown since they may have overlapped the name of another county. If the map is zoomed into just one of the counties in which the label was not visible it should appear. Note: all of the labels are horizontal since no changes have been made with the placement. Return to the Labels tab in the property window.
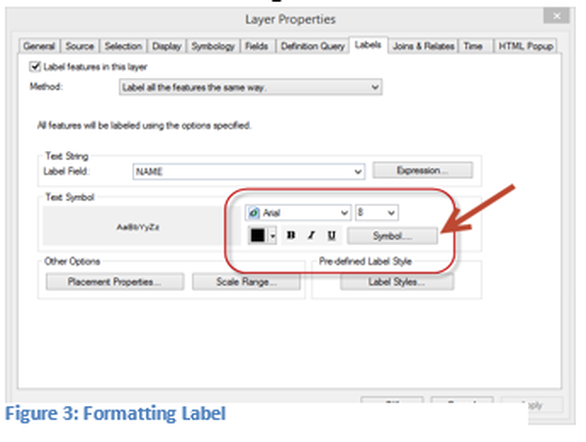
The next area that will be selected is the text symbol area, shown in Figure 3, with the red box. Change the formatting of the labels, by selecting a different font face, color and size for the label, apply these changes and view the effects on the map. Return again to the Labels tab and select the Symbol button. Once selected a new window will open which provides the same controls as the red box in Figure 3 plus additional features for editing the symbol and style preferences. Select the Edit Symbol button. The Editor window allows the user to modify the formatting of the text, the position of how the text will appear such as both vertical and horizontal alignment. It is suggested that the user experiment with these areas of change. Note: anytime a modification is made the user must apply the change to see the results on a map. The Expression button above the box in Figure 3 has several different features. For this lesson only the combining of fields into a single label will be discussed.
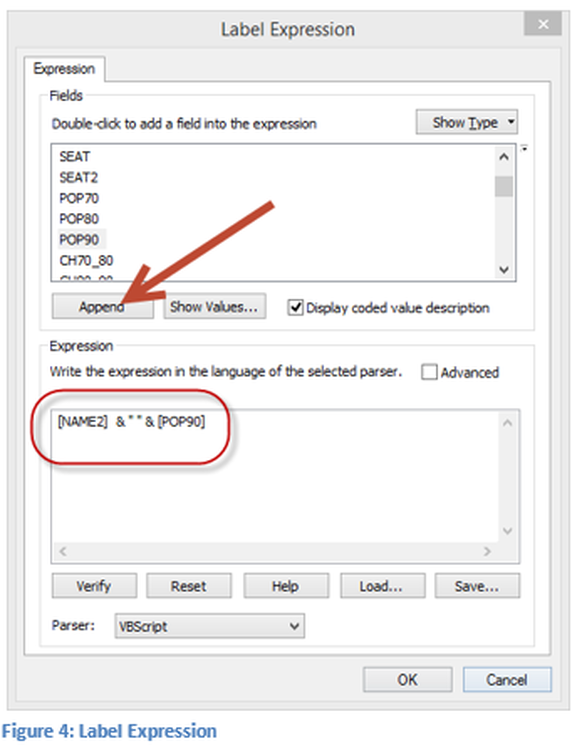
Click on the expression button to open the dialogue box as seen in Figure 4. The completed expression is shown in the red box in Figure 4. This expression was created using the Append button. The process was to select the county name by double clicking on the Name 2. In the list was the field POP90, which is the county population for 1990. The field was highlighted and the Append button was used, which created the expression inside the box. When the processes is accepted, the user is brought back to the Layer Properties window.
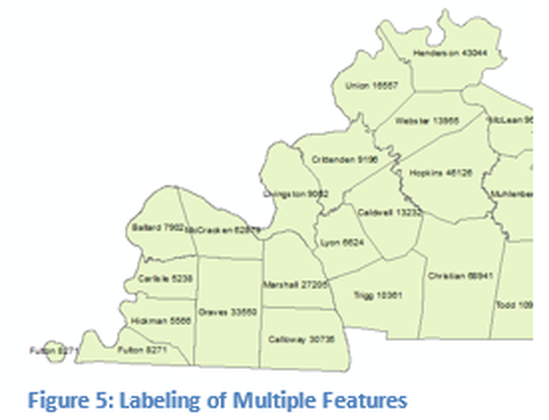
Click Apply, the map now contains both county names and the 1990 population for each county, see Figure 5. The Label Expression window also allows the user to write a script in Visual Basic or Python along with Cascading Style Sheet code (CSS), which is beyond the scope of this course. For example, if a map displaying railroads within a state, the user could label each companies tracks with a different color or font, by using a script.
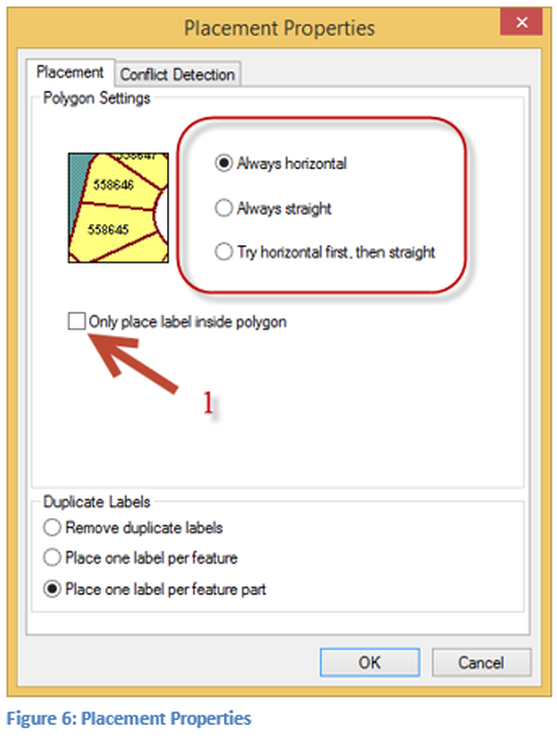
On the Labels window select the Placement Properties button, which opens a new window for the user to control how labels will be placed on a map, see Figure 6. The default is that each feature is labeled and that the labels are horizontal. Arrow 1, points to a check box that allows the designer the ability to keep labels within the polygon. Note: this window will look slightly different for points and lines. Generally labels are kept within the polygon. The red box above the arrow allows the user the ability to control how the label will look. The default is to keep the label horizontal. The second choice is for the text to remain straight and the third choice after horizontal and straight is to follow the curve of the structure. While this is not typically done within a polygon, it would be used, for example, with a line representing a river.
In the duplicate labels section, for the Kentucky county map, the default was selected which labels each feature. Kentucky has only one county that has more than one polygon. This occurs in far western Kentucky, where the path of the Mississippi River has changed and thus there is a part of the Fulton County that is not connected, see Figure 5. Other states that have many islands would be another example where duplicate labels become an important consideration.
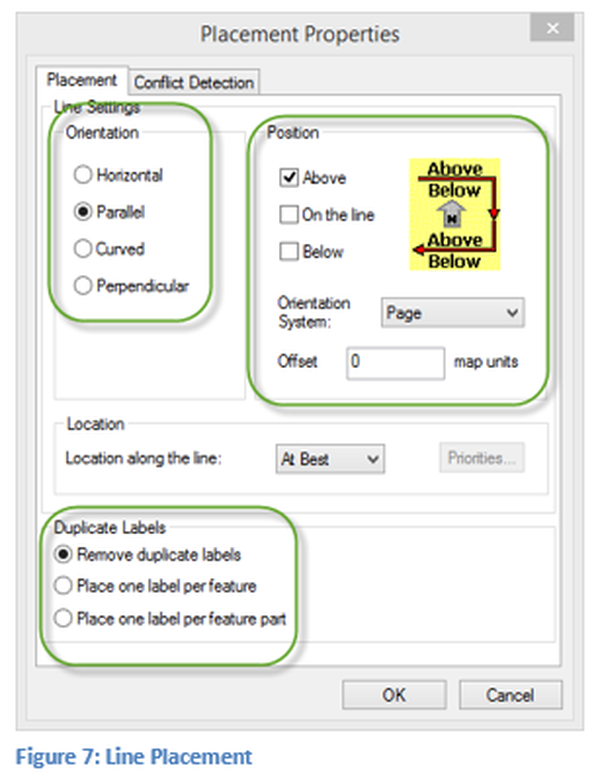
For a line, the Placement Properties window has a different appearance and functionalities, for example, you cannot put a label inside a polygon since it is a line feature. Turn on the river layer and go to the Label tab in the property window and select Placement Properties. The window should be appear similar to Figure 7. There are three major function areas in the lower box, with the same structure as a polygon, in Figure 6. The left box highlights a similar property as with a polygon but slightly different. The displaying of the label orientation for the line function can be Horizontal, Parallel, Curved or Perpendicular. A curved label for example would follow the shape of the river and a perpendicular label would be at a right angle to the line, which is a new orientation from what was available for a polygon. The right box in Figure 7, provides position control such as Below the line, On the line, or Above the line.
For a line, the Placement Properties window has a different appearance and functionalities, for example, you cannot put a label inside a polygon since it is a line feature. Turn on the river layer and go to the Label tab in the property window and select Placement Properties. The window should be appear similar to Figure 7. There are three major function areas in the lower box, with the same structure as a polygon, in Figure 6. The left box highlights a similar property as with a polygon but slightly different. The displaying of the label orientation for the line function can be Horizontal, Parallel, Curved or Perpendicular. A curved label for example would follow the shape of the river and a perpendicular label would be at a right angle to the line, which is a new orientation from what was available for a polygon. The right box in Figure 7, provides position control such as Below the line, On the line, or Above the line.
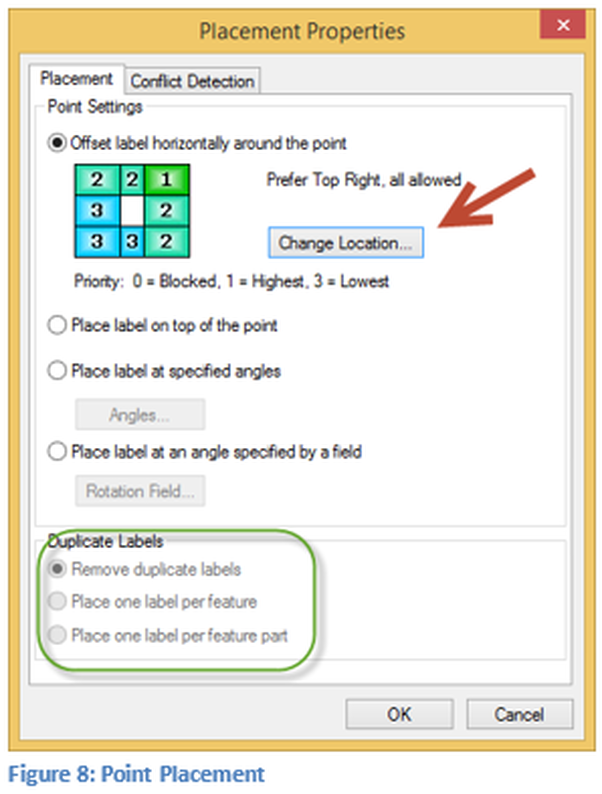
For a point file, the Label tab again has different selections in the Placement Properties window. When this window is opened the green box at the bottom is similar to those seen for lines and polygons. The difference is the box contains the numbers of 1, 2, and 3. This box is referring to the preferred positions for the placement of labels. The point would correspond to the white square inside of the box. The preferred placement location is represented with #1. If that position is blocked by another label the second position would be one of the #2s. Finally if those positions are also blocked the third solution would be the #3 positions. The box displayed in Figure 8 shows the default positions but the user may select different positions. Click on the Change Location button will open a window as seen in Figure 9.
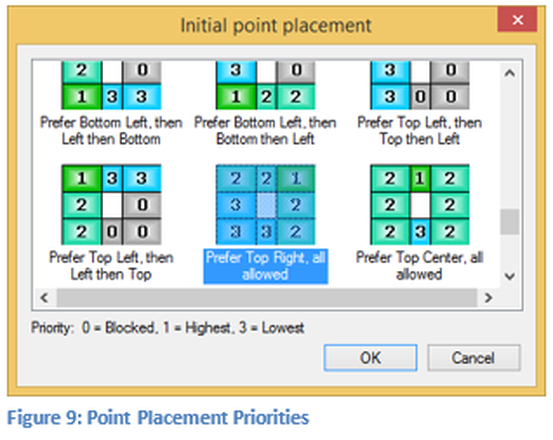
The user would highlight the desired placement of the label properties and select OK. It is suggested that the learner explores some of the different possibilities, shown in Figure 9. It is possible to force the label to a single position. The boxes that are grayed out and have a 0 are blocked positions for the label.

