Process
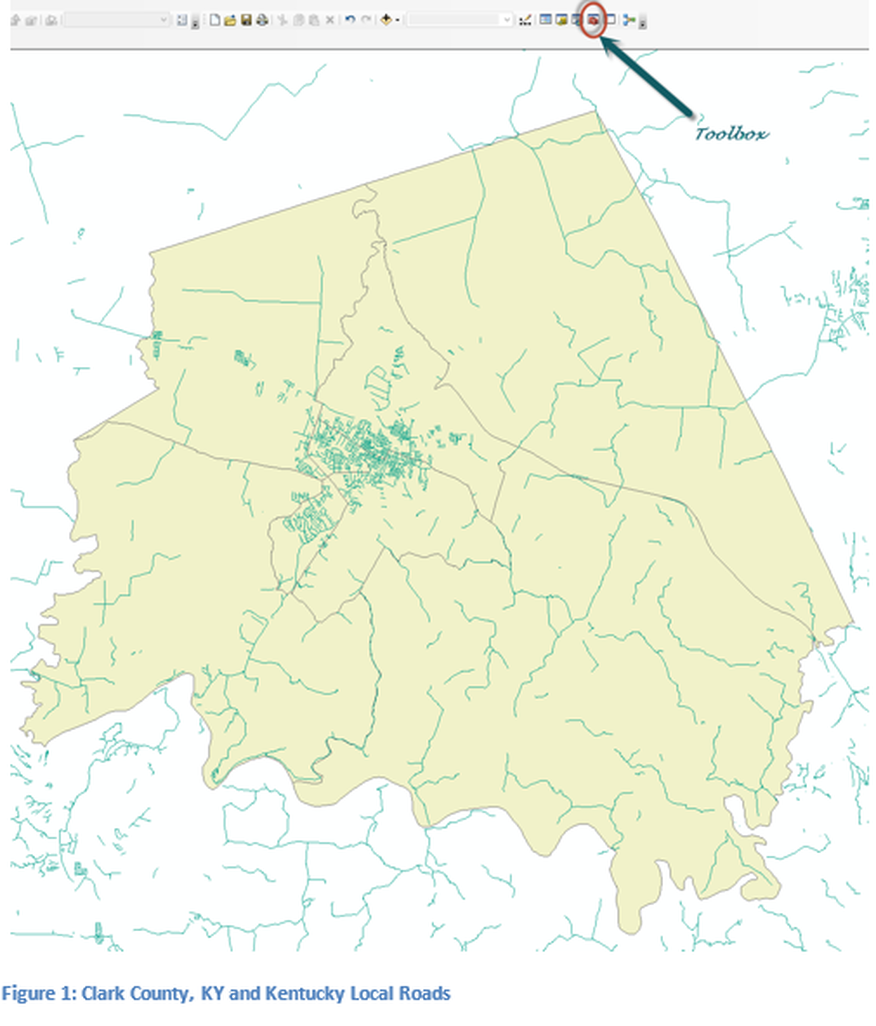
Once the shapefiles have been decompressed add the data into Esri ArcMap Desktop, remember the storage location of the files should not change as this will affect the data drawn on the map. Two shapefiles should be loaded into ArcMap as seen in Error! Reference source not found.. Zoom to the county boundary file. The polygon shapefile is the lower layer and contains the Census Tracts for Clark County, KY (the polygon file may have a different fill color). The green lines represent the roads of the entire state of Kentucky. The concentration of roads in the center of the map is the city of Winchester, KY. The Clark County Census Tract shapefile will be the clipping boundary and the road file will be clipped to contain only the roads within Clark County. Note that the roads initially extend beyond the county boundary (the color of the roads may be different).
Click on the Toolbox symbol as noted in Figure 1 to open Toolbox in ArcMap. The Toolbox contains specific tools for geoprocessing operations.
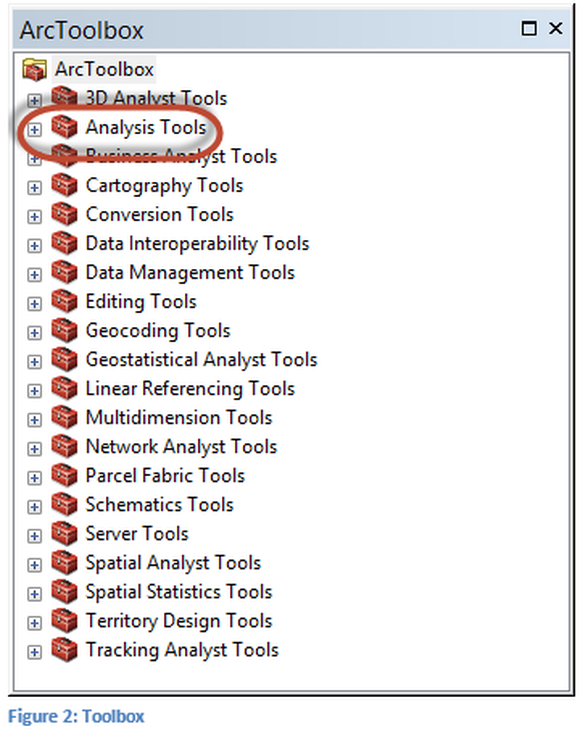
When the Toolbox opens it should look similar to the window in Figure 2. Click on the Analysis Tools which will open the specific toolbox required. When this tool is selected it will provide several choices
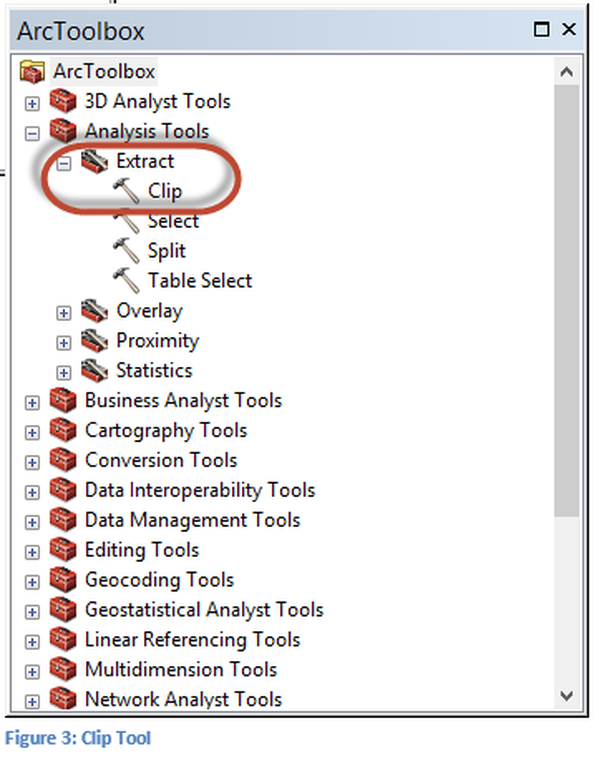
In Figure 3 the results of opening the Analysis Toolbox is displayed. Select the Extract Tray, which contains several tools. Select the Clip Tool and the Clip window will open as shown in Figure 4
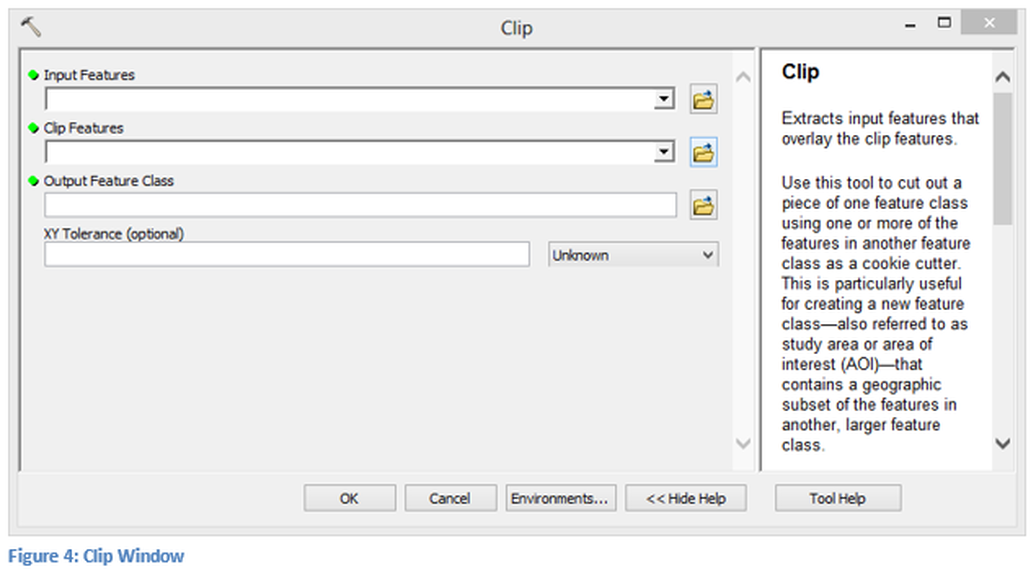
The Clip windows gives multi-parameters, only the first three parameters as noted with green dots will be used for this technical skills lesson.
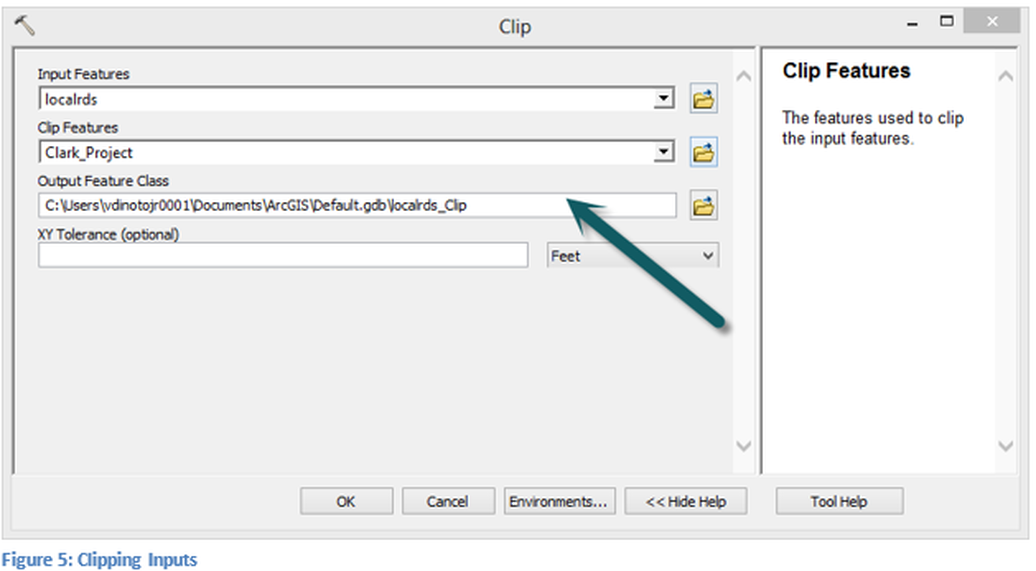
The Input Features will be the shapefile that will be clipped, i.e. the Kentucky Road file. If the
layer is visible on the map use the pull down arrow, if not use the icon folder to locate the folder.
For our example the pull down arrow is used. For the Clip Features use the pull down arrow (the
file folder button works in the same fashion as just discussed) and click on the Clark County
Kentucky Census Tract file. Only polygon shapefiles would be displayed if more than one was loaded on the map. The Clip tool will select a storage location and a name for the new shapefile
automatically in the Output Feature Class. The name should be modified using the proper
naming convention and the file storage location should be appropriate. Use the file folder to
change the saving location and name. These are the only parameters that will be used for this
lesson. Press OK to begin the process.
The progress of the clipping operation will be displayed on the bottom right corner of your map window and an information box will open when the process is completed. The speed of the computer and the complexity of the data set, will determine how much time this process will take. The new shapefile will be displayed on the map once the process has been successfully completed. The red lines on the map in Figure 6 show
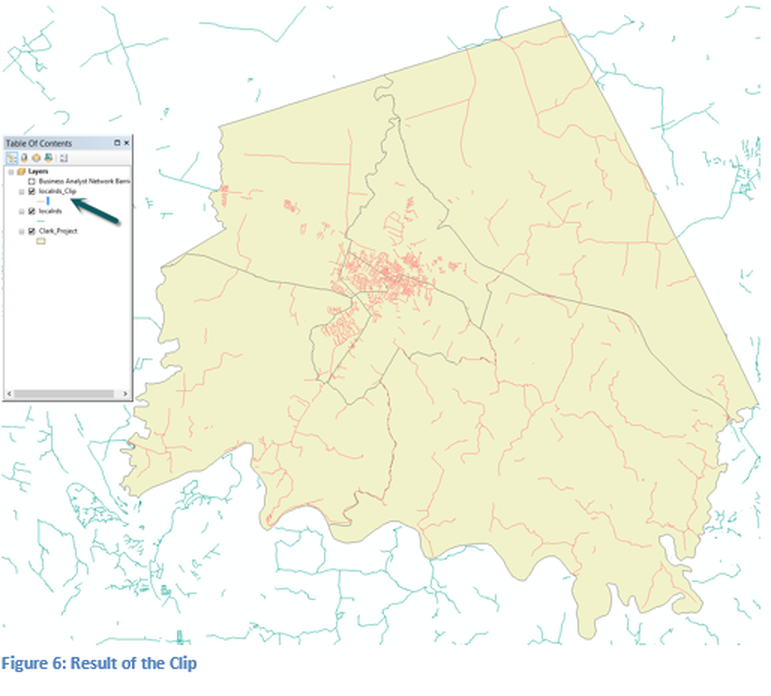
the results of the clip. The local Kentucky road shapefile is visible outside of the county boundary. To complete the process either turn off the original road layer or remove it from the map (recommended).
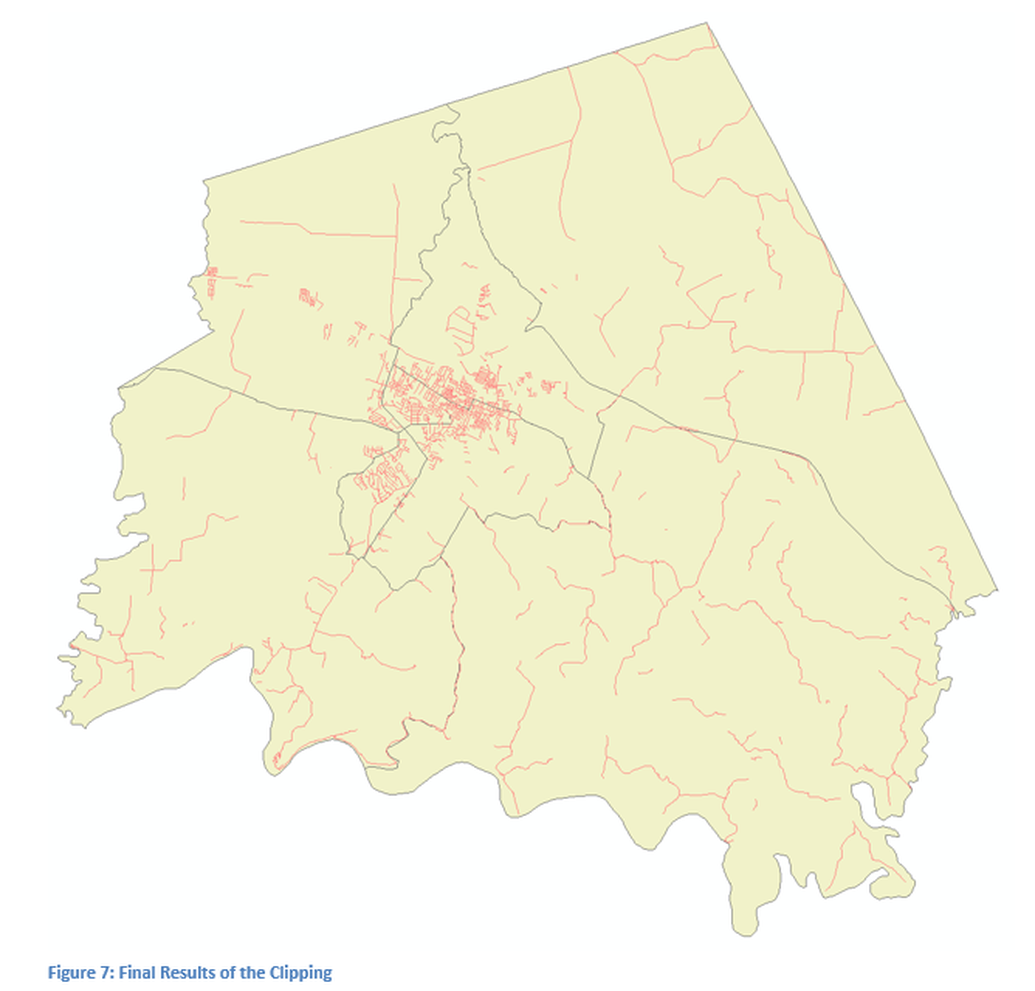
The final results of the process are displayed in Figure 7. Note: the gray lines are the boundaries of the census tracts and are not roads.

