Print Preview
The next step is to observe what the map will look like before it is printed or exported. Go to the File Menu and select Print Preview.
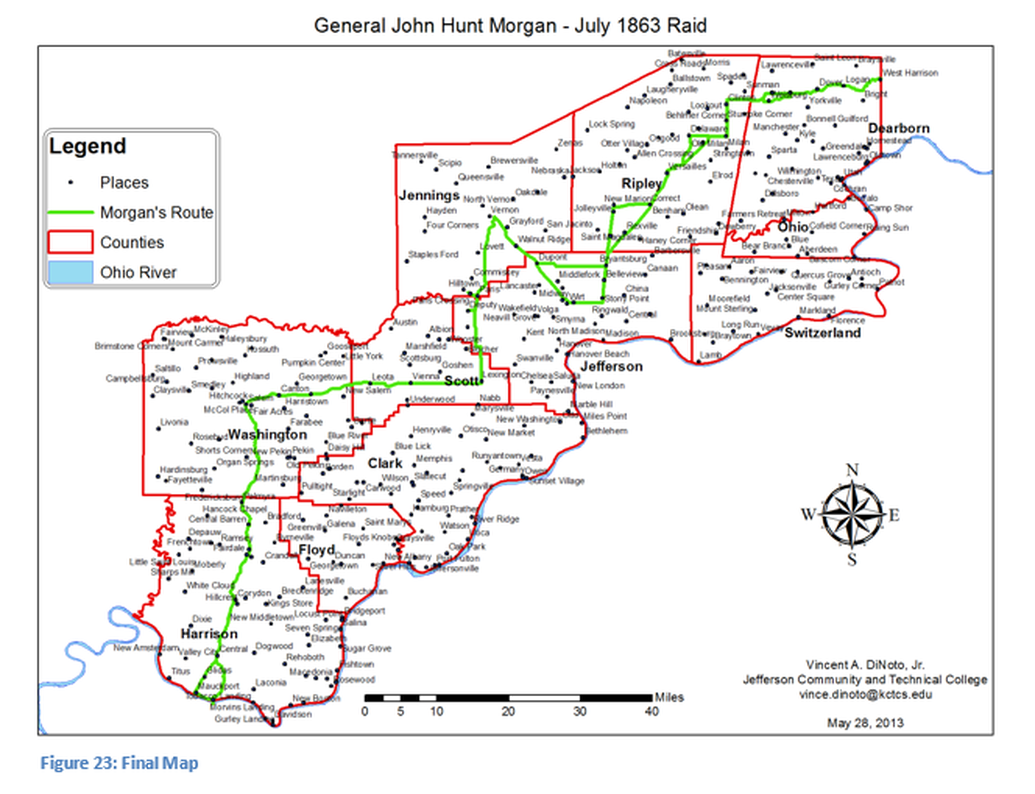
Figure 23 shows the final results of creating the map. Note the Title defines the map, the legend shows four layers on the map, Places, Morgan’s Route, Indiana Counties and the Ohio River. The arrow and scale provide the user with information on map properties. The arrow shows the orientation of the map and the scale bar creates a sense of size. The text box provides information about the creator of the map.
At this point the map can be either printed, or created into an image file or as a pdf. To create an image or pdf file use the export command under the file menu, make sure an appropriate resolution is selected for the purpose of the map, the greater the resolution the larger the map file. Compare the information shown on the final map, as seen in Figure 23 to the initial map in Figure 1. Note how much more can be understood about the map, thus reducing the amount of narrative required.
Predefined Layout
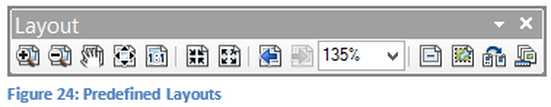
Esri ArcGis Desktop also has predefined layouts that may be accessed via the Change Layout Button on the Layout Tool Bar. In addition templates can be constructed and saved in the change layout area. Some of the templates bring a professional appearance to the map, eliminate time to create the final map, but they also can limit the appearance of the map. If a template is to be selected it should be used prior to placing legend, scales, etc. on the map. It is suggested that the learner try some of the templates with the initial four shapefiles used in this exercise.
Data Frame
A Data Frame is the area in which mapping is being controlled. Typically a single data frame is used on a map, but multiple data frames can be
displayed on a single map document. A data frame can contain, the projection of the map, the coordinate system, and the area being displayed. A similar term from cartography is map body.
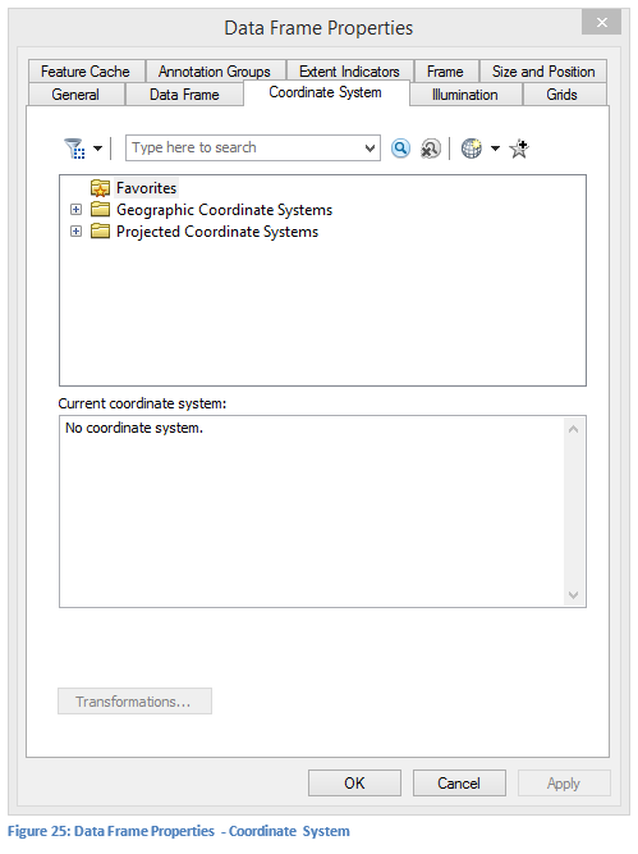
The creation of a new data frame is relatively easy process. Under the Insert tab within Esri ArcGis Desktop, the first item is Data Frame when selected a new data frame will be added to the table of contents. To switch between data frames use the Activate button, which is in the layer menu (right click on the data frame near the bottom of the list). Right click on the new data frame to access the properties menu. The discussion in this section will also work for existing data frames. When the data frame properties window was opened the first tab displayed was the coordinate systems tab. Selecting a projection for the data frame ensures that all files loaded into this data frame will have the same projection. When a projection is not selected prior to loading data the first file will become the projection used by the data frame.
The creation of a new data frame is relatively easy process. Under the Insert tab within Esri ArcGis Desktop, the first item is Data Frame when selected a new data frame will be added to the table of contents. To switch between data frames use the Activate button, which is in the layer menu (right click on the data frame near the bottom of the list). Right click on the new data frame to access the properties menu. The discussion in this section will also work for existing data frames. When the data frame properties window was opened the first tab displayed was the coordinate systems tab. Selecting a projection for the data frame ensures that all files loaded into this data frame will have the same projection. When a projection is not selected prior to loading data the first file will become the projection used by the data frame.
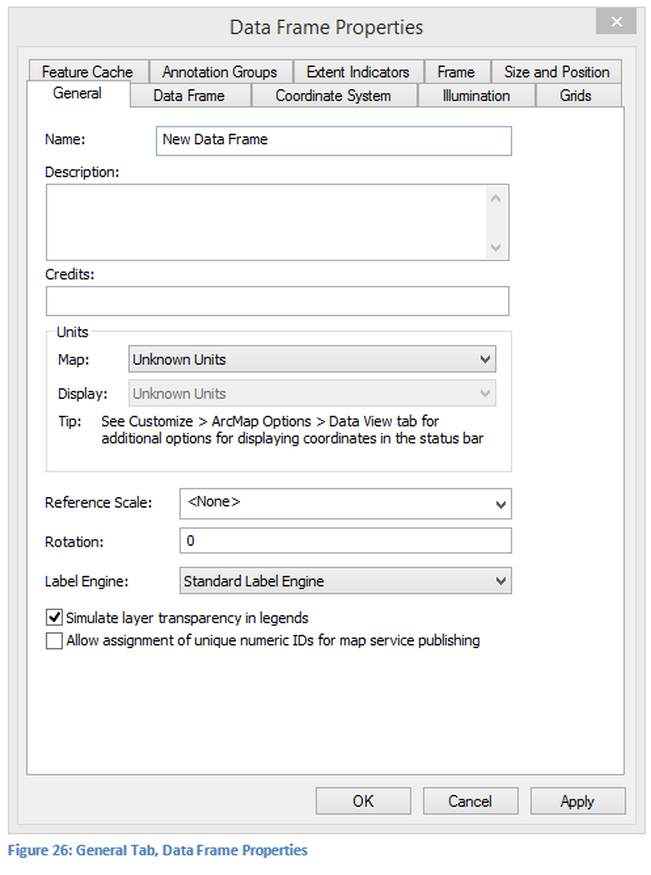
In this location the users can modify the name of the newly created or any other data frame. This should be done when the project is created or the data frame added. A description and credits should be given to the data frame. This is important so that the information can be used for other projects in the future. In addition the user can set the units that will be used and also the scale range.
Several of the concepts of what can be controlled in this properties window is outside the scope of this course. When working in a map with multiple data frames it is no different than normal except that the user needs to know which data frame they are working with. In data view only a single data frame can be used, but can be switched back and forth by selecting the one to use. In the layout view multiple data frames can be used in a single layout. This might be a county map as the main object and a small overview map of all the counties of the state with the particular county highlighted.
Several of the concepts of what can be controlled in this properties window is outside the scope of this course. When working in a map with multiple data frames it is no different than normal except that the user needs to know which data frame they are working with. In data view only a single data frame can be used, but can be switched back and forth by selecting the one to use. In the layout view multiple data frames can be used in a single layout. This might be a county map as the main object and a small overview map of all the counties of the state with the particular county highlighted.

