Projections
It is not practical to work with a three-dimensional representation of the earth such as a globe. Therefore when a map is created it is on a two-dimensional surface, but the Earth is a three-dimensional object that appears as a ball, though not a true sphere[1]. The Earth also has elevation changes such as mountains and river valleys. Therefore, it requires mathematical models that project the Earth’s surface onto a two dimensional planar surface.
Think of taking the Earth and cutting a line from pole to pole following a meridian[2]. Think of peeling away the Earth’s surface , now try laying it flat without tearing or distorting the surface, this is not possible. Try doing this with an orange, remove the skin from the orange in two pieces, by making a cut all the way around from the attachment point, through the bottom and back to the attachment point, don’t worrying about the fruit inside. Take one of the two halves of the skin and try to lay it perfectly flat without tearing it. What was the result? It was most likely discovered that this is not possible without tearing the skin and thus it becomes non-contiguous.
Think of taking the Earth and cutting a line from pole to pole following a meridian[2]. Think of peeling away the Earth’s surface , now try laying it flat without tearing or distorting the surface, this is not possible. Try doing this with an orange, remove the skin from the orange in two pieces, by making a cut all the way around from the attachment point, through the bottom and back to the attachment point, don’t worrying about the fruit inside. Take one of the two halves of the skin and try to lay it perfectly flat without tearing it. What was the result? It was most likely discovered that this is not possible without tearing the skin and thus it becomes non-contiguous.
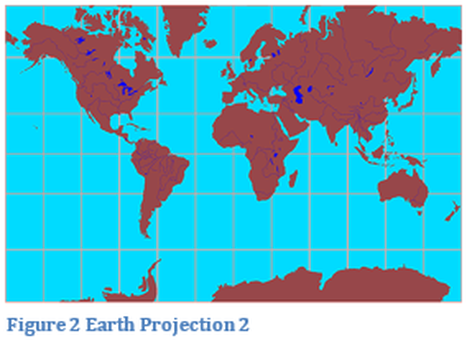
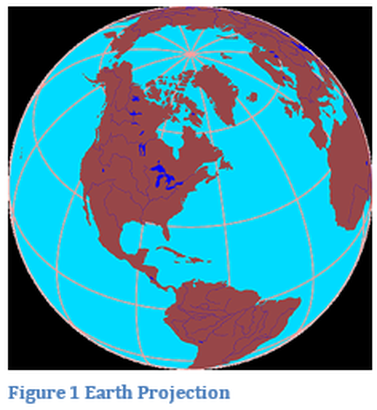
Therefore, an approximation of some type must be used to project the three-dimensional earth onto a two-dimension flat surface. Figure 2 shows that the lines run parallel and perpendicular to the equator, they have the same distance separation between one vertical line and another no matter how far the lines are away from the equator. But in Figure 1 these same vertical lines are moving closer together. They eventually reach a point called the north and south poles. The angular distance (degrees) between two lines would be the same in either figure, but the linear distance would be different. Since these differences occur there would be distortions. Thus the lands in the far north (also in the far south) have been drastically distorted especially in the east-west position. The northern states in the United States appear much bigger in this projection than they really are, the same is true for Greenland. There are many different types of projections, which approximate the earth on a plane.
Mercator
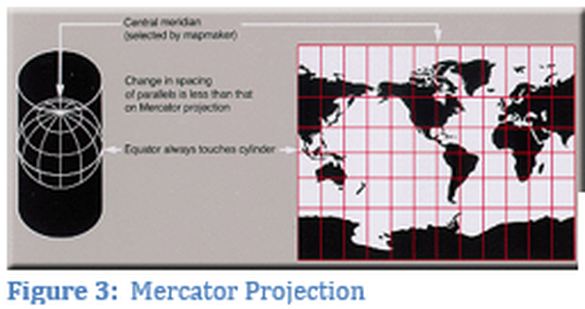
Figures 3 and 4 are representations of a cylindrical projection. Think of a piece of paper, shaped into a cylinder and wrapped around the earth with the equator touching at all points of the cylinder. Then taking the lines of latitude and longitude and projecting them onto the cylinder. Next project the landform on to the cylinder.
|
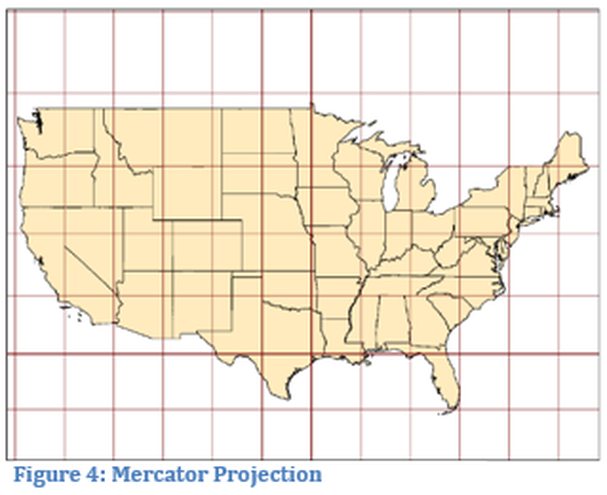
Take the piece of paper and lay it flat. The areas near the equator will have relatively little distortion but areas near the poles will have a great amount of distortion. This type of projection shown in Figure 3 and 4 is refered to as the Mercator projection. As mentioned previously there are many map sources that are used on the web, such as Google Maps, Bing Maps, OpenStreetMaps and Esri maps. These maps utilize a web Mercator projection, which is very similar to a regular Mercator projection.
|
|
Transverse Mercator
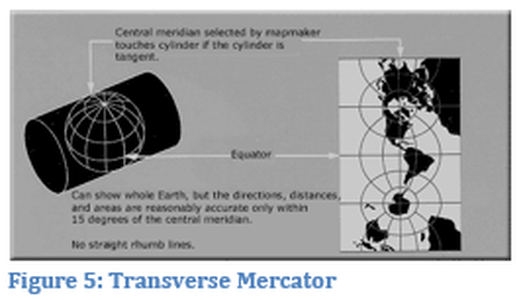
A transverse Mercator projection is similar to the Mercator projection except the cylinder is placed so that it touches both of the poles and along two lines of longitude. The transverse Mercator projection allows for a meridian on each side of the earth to be in constant contact at all latitudes of the surface of the earth, see Figure 5. As other lines of longitude are observed the distortion increases and the farther away the greater the distortions.
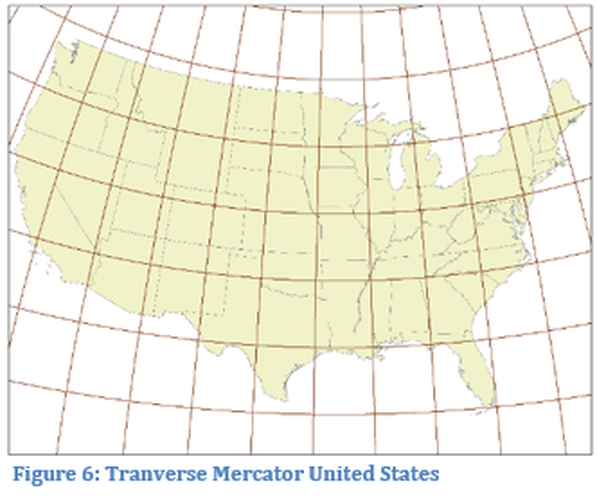
There are many Transverse Mercator projections for the surface of the earth. The projection used on a map project will be determined by the nearest Meridian. In Figure 6 a central meridian was selected for the United States and note; the lines are no longer parallel as was observed on the Mercator projection.
Conic
|
|
|
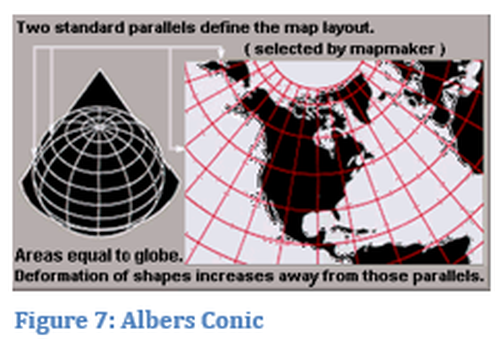
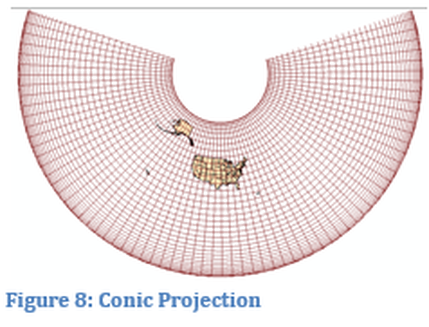
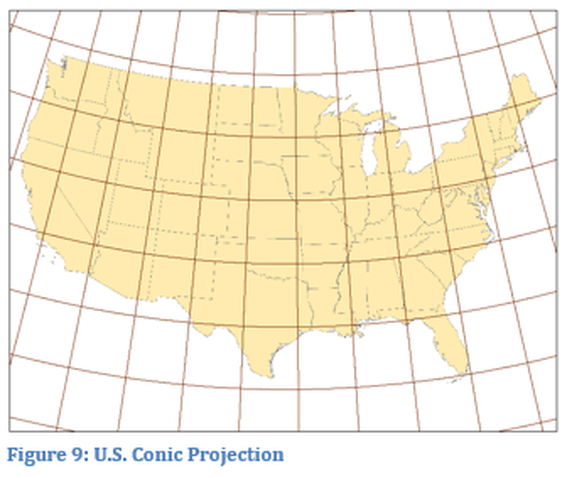
Another common type of projection is refered to as a conic projection. An imagery cone is placed over the earth as seen in figure 7. There are areas of the cone much closer to the surface than in the previous projections. The slope of the cone can be changed depending on the latitude that will be in contact with the surface of the earth. The projection can only be used in a single hemisphere. In figure 8 the cone has been flattened to show the results of the projection. The United States can be seen in Figure 9, the lines of longitude are not parallel and radiate away from the center of the projection. Thus the linear distance between the longitude lines are smaller in the northern latitudes and farther apart in the more southern latitudes.
|
|
Using a Projection
|
|
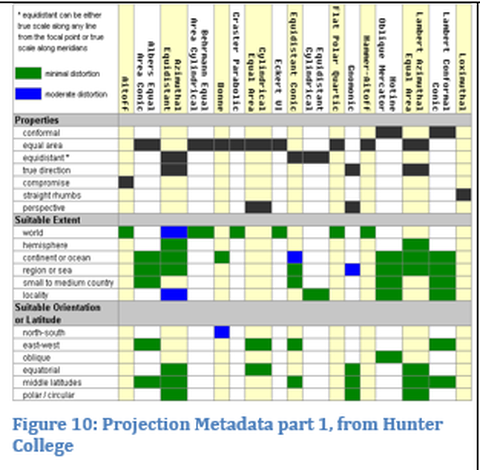
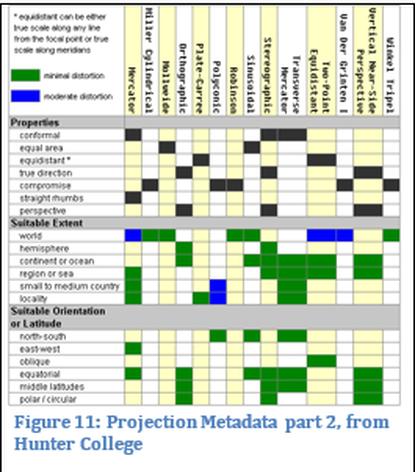
There are many other types of projections which can be used, the real concept that can be taken away is that some projection types are more appropriate than others when creating a map. Figures 10 and 11 provide a partial list of projections, these lists came from a Hunter College website. Determining the correct projection is critical for the proper presentation of a map. For example: the projection used at a city level would be very different than what would be used for the entire United States or the world.
In this course a basic understanding about projections is important. No mathematical calculations will be required on projections and coordinate systems, since the software will accomplish these tasks. If data is not projected, it will not display properly and two different datasets may not align properly. If you have two datasets that are projected, the software will do a conversion between the datasets so that they are displayed appropriately. The first dataset loaded onto the map is generally the projection that the data frame will use. Un-projected data should be projected and can be done so through the tools in the Esri Toolbox. Another good resource for information about projections is from Ball State University: http://www.bsu.edu/libraries/collections/gcmc/tutorials/pdfs/mapscartographymapprojections.pdf
In this course a basic understanding about projections is important. No mathematical calculations will be required on projections and coordinate systems, since the software will accomplish these tasks. If data is not projected, it will not display properly and two different datasets may not align properly. If you have two datasets that are projected, the software will do a conversion between the datasets so that they are displayed appropriately. The first dataset loaded onto the map is generally the projection that the data frame will use. Un-projected data should be projected and can be done so through the tools in the Esri Toolbox. Another good resource for information about projections is from Ball State University: http://www.bsu.edu/libraries/collections/gcmc/tutorials/pdfs/mapscartographymapprojections.pdf

