Process
Case I Simple Query
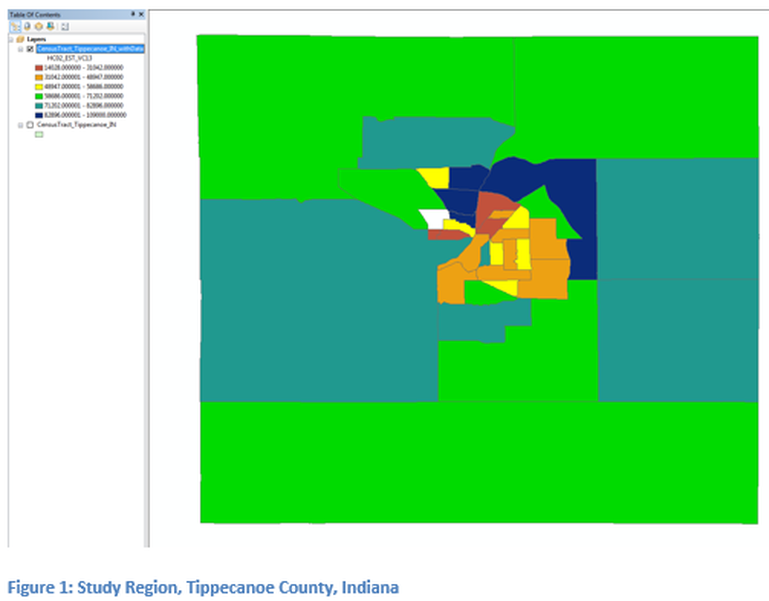
Load a shapefile that has demographical data at census tract level, the shapefile must contain either multiple counties, or a county with at least 15 census tracts, this maybe a file that was created in another lesson. For this example, the author will use Tippecanoe County in Indiana, as shown in Figure 1. The shapefile should contain Educational Attainment (S1501) and Median Income (S1901). Figure 1 displays the income at the census tract level for S1901, showing attribute HC02_EST_VC13, Median Income, from the American Community Survey. The learner may select a county or region of interest as long as the basic criteria is met.
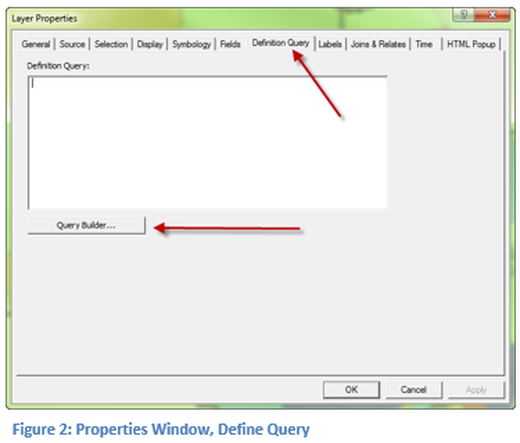
Open the Layer Properties Window for the census tract file and select the Definition Query tab. Next select the Query Builder button to open a window to assist in writing the query. Proper formatting of the query statement is extremely important and a minor error in the writing of the statement will cause the query not to work properly. It is strongly suggested to always use the query builder and not write your queries directly in this window (Figure 2), because of the care that must be taken in formatting the statement correctly.
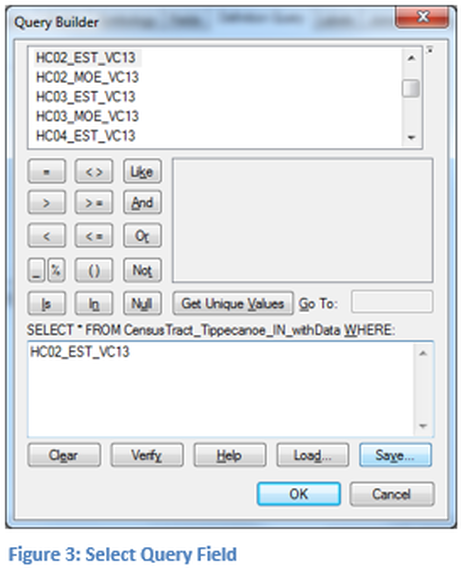
Double click on the HC02_EST_VC13 field and it will be entered in the window below as seen in Figure 3. Remember, this is the field that represents the Median Family Income from the American Community Survey for your selected county.
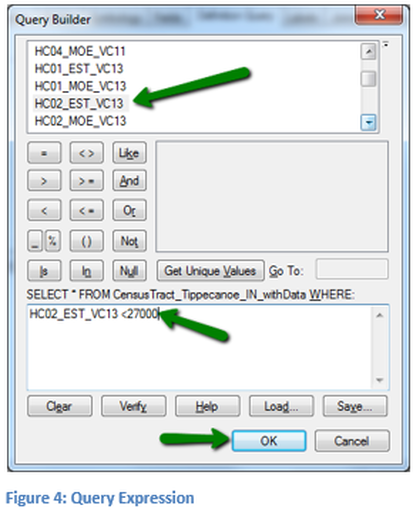
In this step the query will be completed for HC02_EST_VC13. In the query all median incomes that are less than $27,000 per year will be displayed. To write the expression as it appears in the display window in Figure 4, use the less than button and then type the amount (without ‘$’ and ‘,’) it should appear the same as it does in Figure 4: Query Expression. Click OK to continue, this will close the query builder window, but the query function has not been completed.
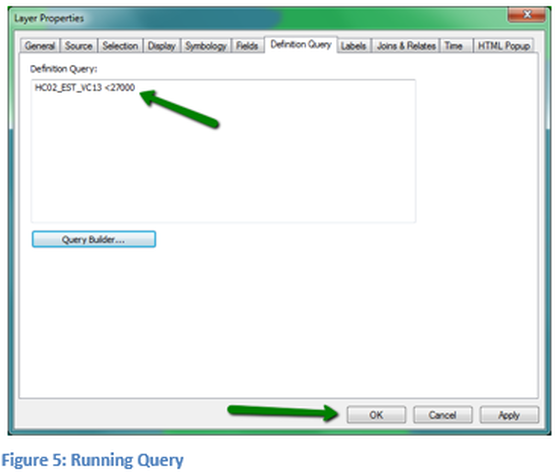
Note: the expression is visible in the upper left corner of the Definition Query Window, see figure 5. Click OK and this will run the query and display the results of the query on the map. Only when the query is true is information displayed. The ramp color was not changed in this operation.
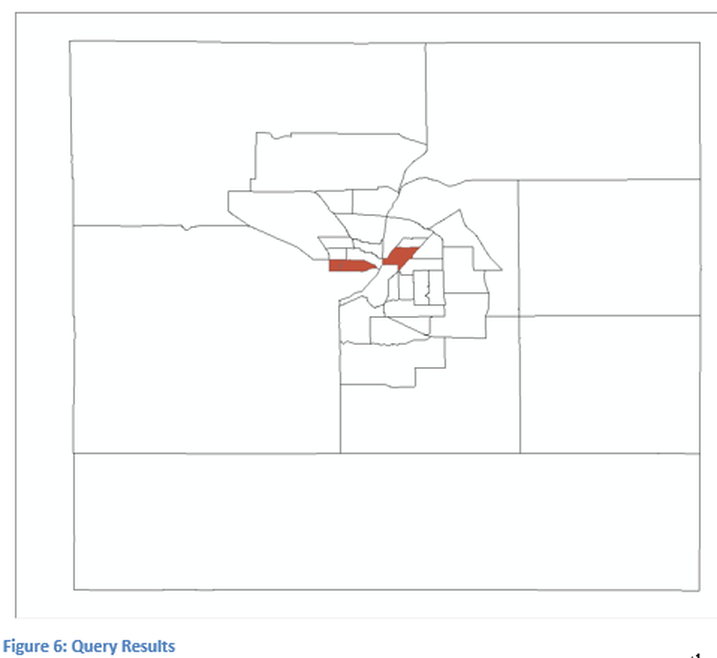
Displayed, in figure 6, is the result of running the query (note: a second copy of the census tracts is displayed to show the entire county). Those Census Tracts that are visible represent the tracts in which the median income is less than $27,000 per year (note if they earn exactly $27,000 they are not shown). The white area of our targeted county shows those areas in which the median income is greater or equal to $27,000. Any attribute in this shapefile could be displayed as a field, which would be set in the symbology tab of the layer properties. The image does not give a legend so which attribute is being displayed and what the colors represent cannot be discerned. To display these properties on a final map would require steps discussed in the publishing technical skills lesson.

