Report Creation
Presentation
The presentation software demonstrated will be Microsoft PowerPoint. This discussion will not teach the user the basics of PowerPoint, but will discuss components that should be included in a presentation. It is assumed that the user can create slides.
1. The first rule in presentation creation is to understand the audience.
a. If the audience is a technical group, they will want to know the methodology used
b. If the audience is a public meeting of general population, the presentation should be very different than that created for a group of geospatial professionals.
c. One of quickest ways to lose an audience is to have the level of the presentation not be appropriate for the group.
2. First select an appropriate template, if the organization has a template that should be used.
a. For Example the GeoTech Center’s color scheme is a light blue and green, using a bright red and yellow template would not be appropriate for the organization.
b. In addition make sure that colors used do not conflict with ADA2 requirements.
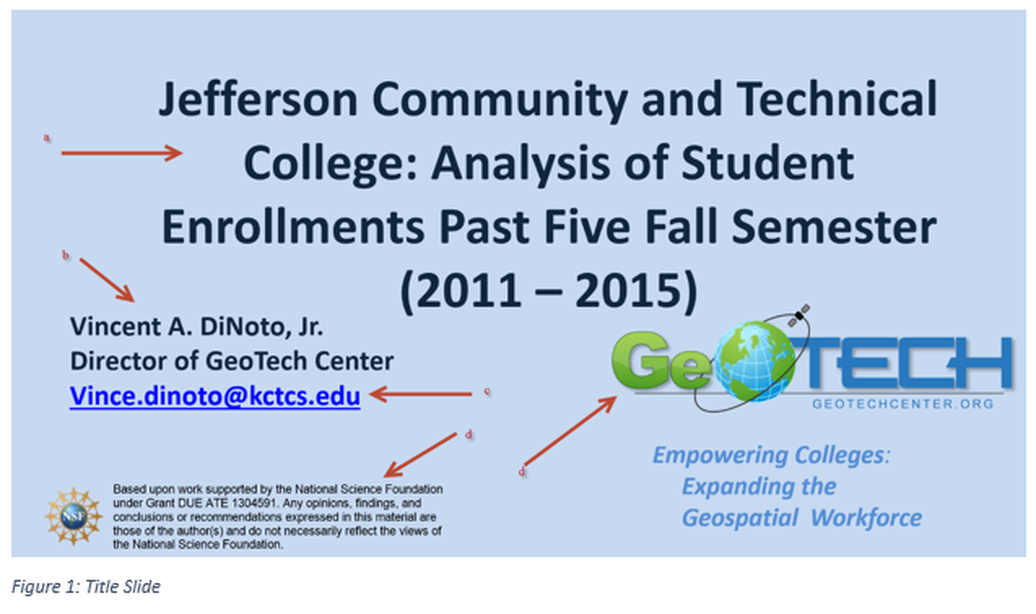
3. All presentations should have a descriptive cover slide. See figure 1.
a. The cover slide should contain the name of the presentation.
b. Author(s) of the presentation, if different.
c. Contact information for the author and presenter.
d. Organizational logo(s).
e. Date of the presentation (useful, but not required).
1. The first rule in presentation creation is to understand the audience.
a. If the audience is a technical group, they will want to know the methodology used
b. If the audience is a public meeting of general population, the presentation should be very different than that created for a group of geospatial professionals.
c. One of quickest ways to lose an audience is to have the level of the presentation not be appropriate for the group.
2. First select an appropriate template, if the organization has a template that should be used.
a. For Example the GeoTech Center’s color scheme is a light blue and green, using a bright red and yellow template would not be appropriate for the organization.
b. In addition make sure that colors used do not conflict with ADA2 requirements.
3. All presentations should have a descriptive cover slide. See figure 1.
a. The cover slide should contain the name of the presentation.
b. Author(s) of the presentation, if different.
c. Contact information for the author and presenter.
d. Organizational logo(s).
e. Date of the presentation (useful, but not required).
4. The next slides should provide information about the presentation and will be a table of contents. This information explains the purpose of the project and how it was conducted.
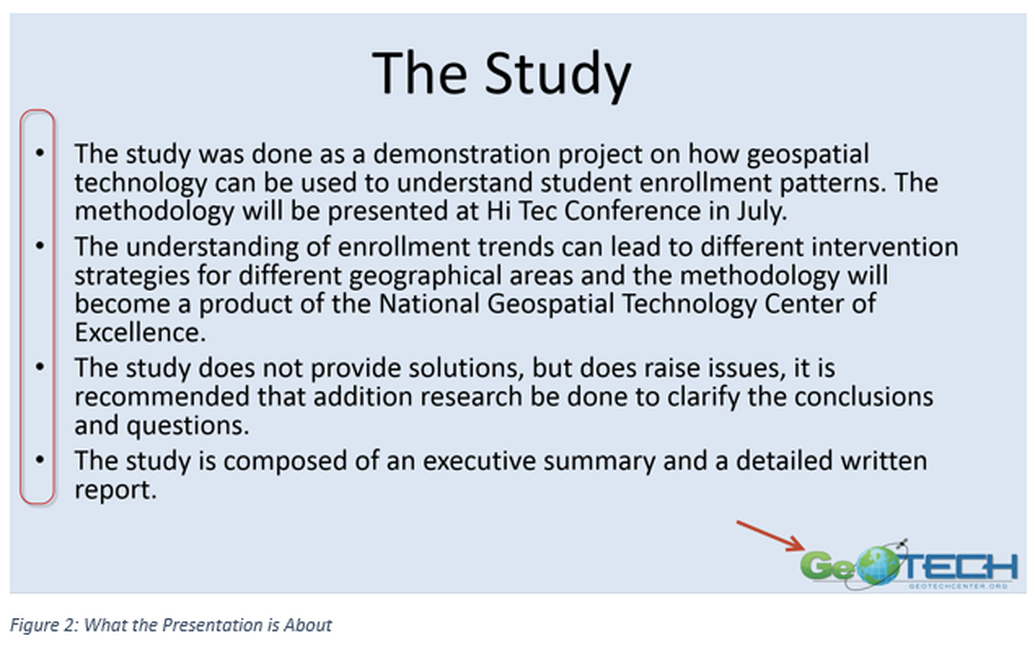
Note, as shown in figure 2, that the organizational logo appears on every slide, it was placed in the footer. The use of numbers and bullet points makes it easier for the audience to understand what is being discussed. Slides may be numbered, but the first slide should not have a visible number.
5. The methods used and source(s) of data in conducting the research should be discussed. But the actual steps to creating the result need not be discussed. For example, the hydraulic information came from the Department of Natural Resources for the entire state and the data was extracted for the 10 county region.
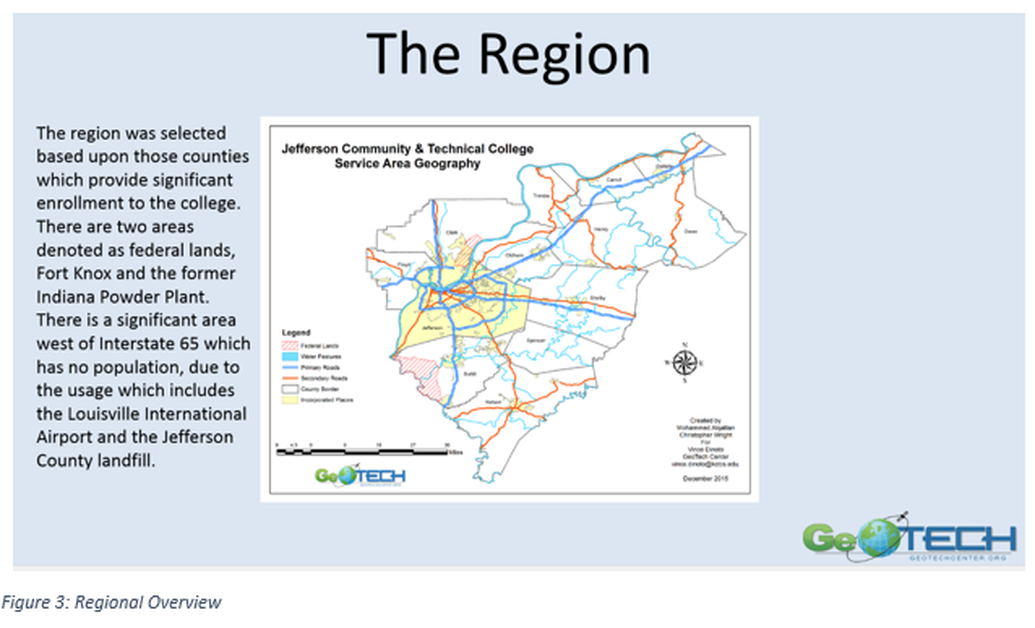
6. The next slide should include an overview of the region of the study, use both text and graphics, as shown in figure
a. To place a picture on a blank slide, click insert and then the image icon.
b. Locate the image and insert it on the slide, this process will be used for all map images that are added to slides.
c. Insert a textbox, add text that explains the map, and align the top of the textbox with the top of the image. Make sure the font size is large enough to be legible.
d. Insure that any terminology that is used is understandable.
e. Do not put a lengthy amount of information in the textbox
7. Insert additional maps to explain the results of the analysis, if there are a large number of maps, use only representative maps to explain the process, if there are multiple processes, it might require a map for each process.
8. In addition to the insertion of a map image other items can be inserted including:
a. Tables, make sure that not too much information is included, not all data should be displayed, only representative information.
b. Pictures are processed the same way as maps, it is usually good to have images if field data collection has occurred, for example, if 100 points were taken only a few representative pictures should be included.
c. Graphs, can be constructed directly in the presentation software.
d. Video can be embedded, remember if any video is located at an external source is used, it can be problematic if connectivity is lost.
9. If there are calculations that are created for the data, an example calculation should either be shown or discussed.
10. At the end of the presentation there should be a conclusion(s)/summary of what was discovered by the analysis, as seen in Figure4. If additional research is required to fully answer the questions that should be included, along with an explanation of what the additional analysis will contribute to the overall solution. As technologist questions arise many times, but they don’t really effect the requirements of the contract.
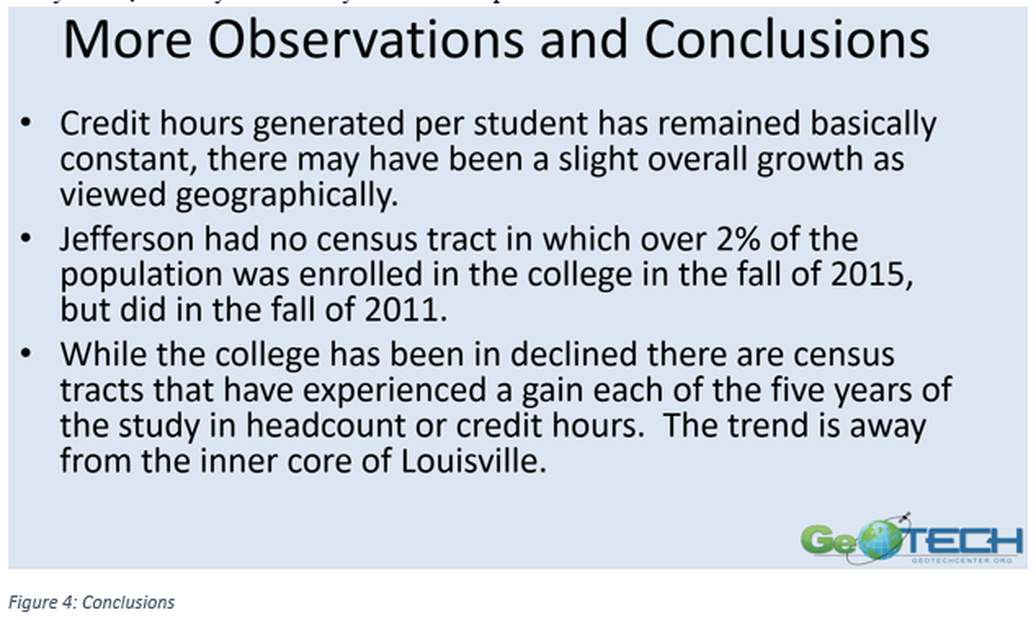
While the researcher might like to explore the answer, does the client need this information?
11. Throughout the presentation any source literature consulted should be noted and referenced before the final slide.
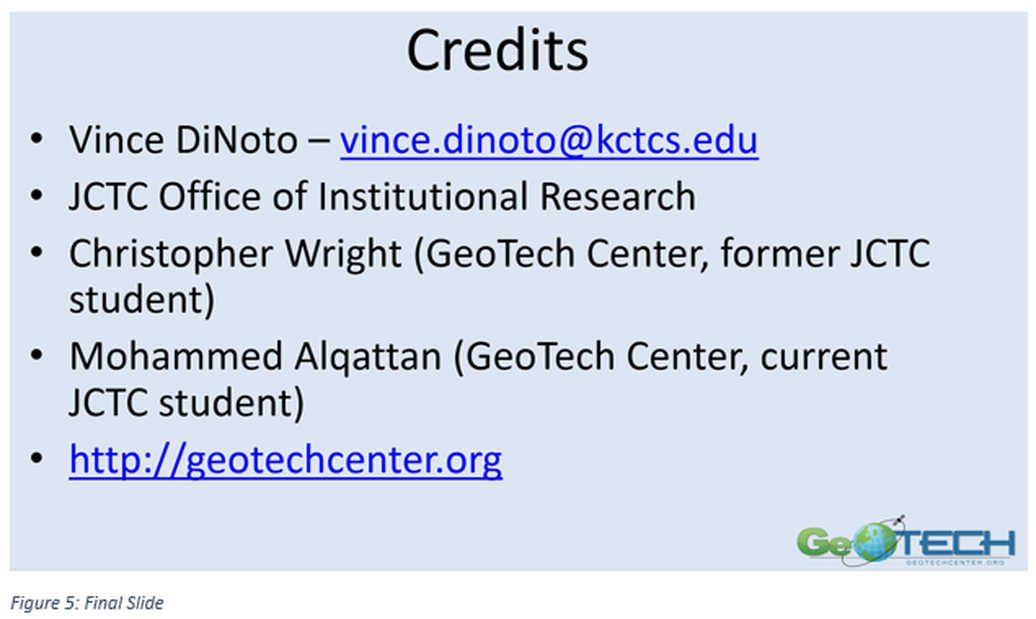
12. The final slide of the presentation, as seen in Figure 5, should include contact information for the presenter.

