Symbology and Classification
Introduction
|
Click here to download the data that the author used for the course lesson. By downloading the data you will be able to follow the steps completely.
|

|
Click on the white "play" button above to watch the "Symbology" video.
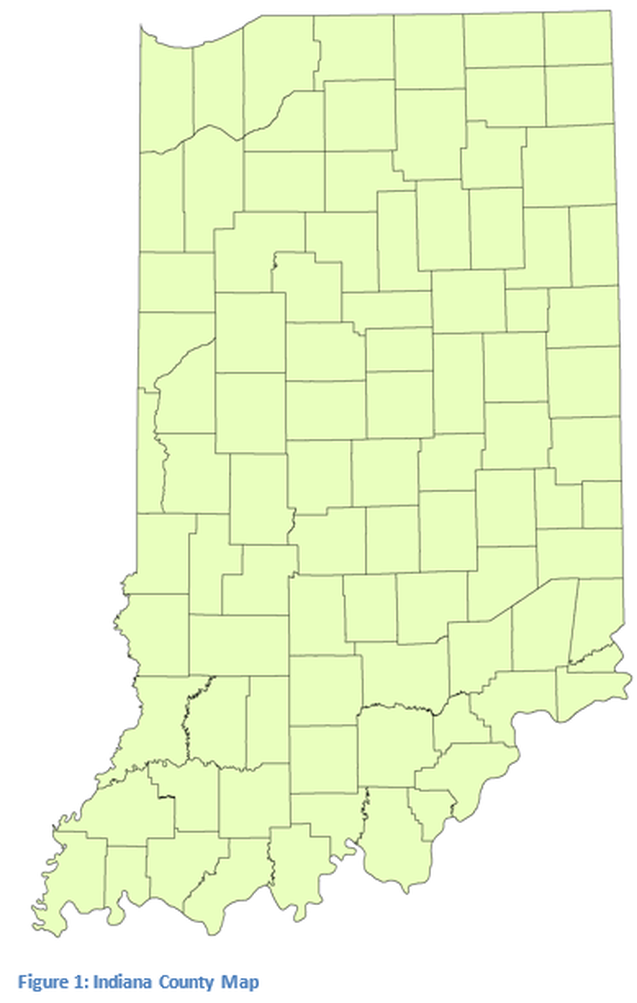
While symbology might not be a real word, it is a term that is used extensively in geospatial technology. Symbology controls the layout of information as it appears on a map. This technical skills lesson will introduce symbology and will contain information that is critical in the creation of appropriate maps. Some very basic symbolism can be changed directly from the table of contents in ArcMap. Additional modifications of appearance are made through the Symbology tab of the Layer Properties Window. Before beginning this lesson a state map showing county boundaries will need to be loaded into the Esri ArcGIS Desktop. The shapefile must have polygon county boundaries. Typically when the shapefile is loaded the counties are filled with the same color and have a gray or black boarder. In this example a county map of the state of Indiana has been loaded.

