Symbol Selector
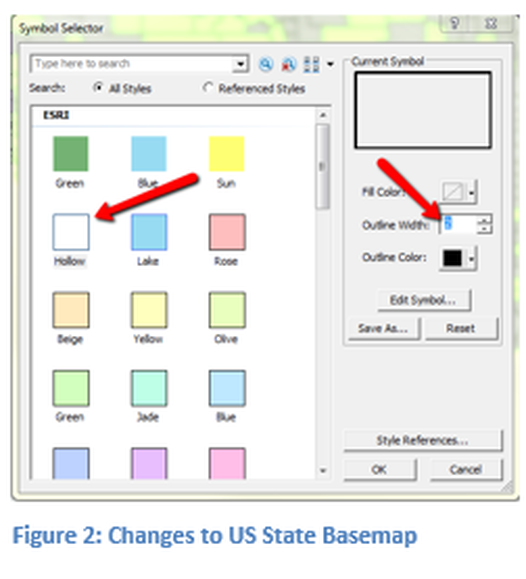
The lowest level map shows the U.S. at the state level. Several of the maps have an opaque fill and making other datasets invisible. The boundary lines are all the same color and thickness. For the U.S. state dataset the fill color might be made transparent (hollow) and the width of the border a wider black line. Double click on the state dataset fill color which should open the Symbol Selector window like Figure 2. Change the fill to hollow, change the outline color to black and change the width to 2. Exit the Symbol Selector, the changes may not be visible since other opaque layers are above this one.
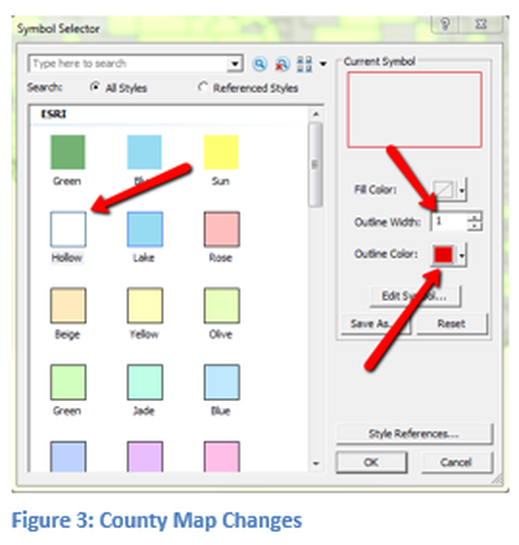
Open the Symbol Selector, as seen in Figure 3, for the U.S. county layer. Select the hollow fill, change the Outline Color to red and the thickness to 1. Exit the Symbol Selector. These changes will make it possible to distinguish state boundaries from county boundaries.
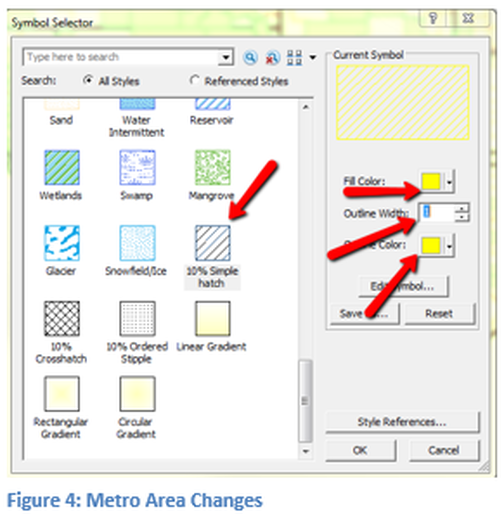
Open the Symbol Selector for the U.S. Metro Area shapefile. This layer will be a 10% simple hatch with a yellow color. Select the 10% Simple hatch, a yellow color and a width of 1, as seen in Figure 4. This will allow other datasets below this layer to be visible by making the second color of the hatch transparent (this is the default). The percentage of hatch and angle of hatch can be modified.
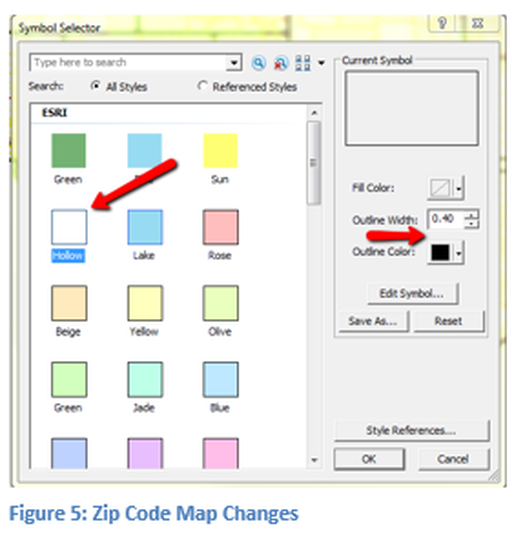
The final symbology change will be to the KY Zip Code shapefile, Open the Symbol Selector make the layer Hollow, with a black Outline and Width of .4. Numerous modifications have been made to better display the data, but still too much information is being presented at one time on the national map.
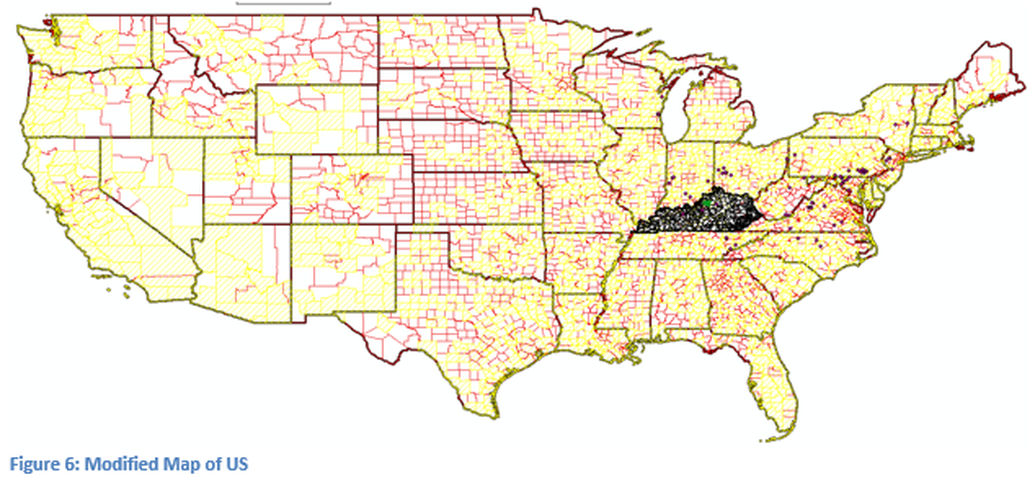
The results of the modifications are visible in Figure 6. While the data is more understandable on the current map, as compared to the map in figure 1, it still has too much information visible at this magnification, especially for Kentucky. In the next part of this lesson automatic data display will be discussed. This concept is useful for many different applications, but critical for online map creation. Some organizations have standards regulating when specific information is visible in static maps.

