Map Publishing - CREATING STATIC MAPS
Click here to start watching the Map Publishing video.
|
Click here to download the data that the author used for the course lesson. By downloading the data you will be able to follow the steps completely.

|
Concept
A map must be appealing to the viewer as well as contain information to explain the purpose to the user. Production maps can take one of two formats they can be dynamic or static. A dynamic map is one in which changes occur on the map as the user modifies settings. The user of static maps cannot change the presented information, static maps in general are in a format such as an image (PNG, TIFF, JPG) or an Adobe Acrobat file format PDF). The map may be embedded into a report or presentation or posted on to a website. The product may also be printed, the final output of the map should be considered as part of the publishing process. Many times multiple versions of the same map are created and with different publishing formats and resolutions. For example the map maybe created as a PNG image to be placed into a Microsoft PowerPoint Presentation and as an Adobe Acrobat format for the user to print. To create these static maps the designer would use the Export command in the File menu, this technical skills lesson will focus on static maps.
Certain items must be included in all static map created for publication: a direction arrow, scale bar, title, creator block and legend. Including this information on a map is important so that the end user can fully understand what the map represents. Text boxes to provide additional information can also be included as well as other drawing symbols. A map should include information about the person(s) who created and designed the map. Contact information for the senior designer should be included, such as an email address. Most organizations require that the organizational logo be included on all final products. The map should contain information about copyright protection as well as the date in which the information was created and potentially downloaded. It is suggested that a map also have a Creative Commons[1] notice if appropriate. Remember that these maps are static and not interactive, since they will either be printed, saved as an image file, or an Adobe Acrobat file. Many companies and organizations create templates which must be used for a final map layout, but as with many projects one size does not always fit all situations.
Certain items must be included in all static map created for publication: a direction arrow, scale bar, title, creator block and legend. Including this information on a map is important so that the end user can fully understand what the map represents. Text boxes to provide additional information can also be included as well as other drawing symbols. A map should include information about the person(s) who created and designed the map. Contact information for the senior designer should be included, such as an email address. Most organizations require that the organizational logo be included on all final products. The map should contain information about copyright protection as well as the date in which the information was created and potentially downloaded. It is suggested that a map also have a Creative Commons[1] notice if appropriate. Remember that these maps are static and not interactive, since they will either be printed, saved as an image file, or an Adobe Acrobat file. Many companies and organizations create templates which must be used for a final map layout, but as with many projects one size does not always fit all situations.
Prerequisite
|
It will be assumed that the learner will have created numerous maps prior to beginning this technical skills lesson. In particular the learner should have completed the technical skill lesson on Symbology and Classification.
Data
Select a map that has been previously created for a technical skills lesson containing at least three layers. A the author is using a new map to meet the criteria for this lesson. The hyperlinks to the data used in this lesson have been provided. All examples in this lesson will refer to the data sets provided, but same procedures can be accomplished with data of the learner’s choice.
|
The Indiana County Map Named Places and the Ohio River are located at: https://drive.google.com/open?id=12BZxF_1h9CFhKpFwXNtlrByHZ8-vV7jG . Click on the “I” Tab and then select Indiana, download each and decompress (unzip).
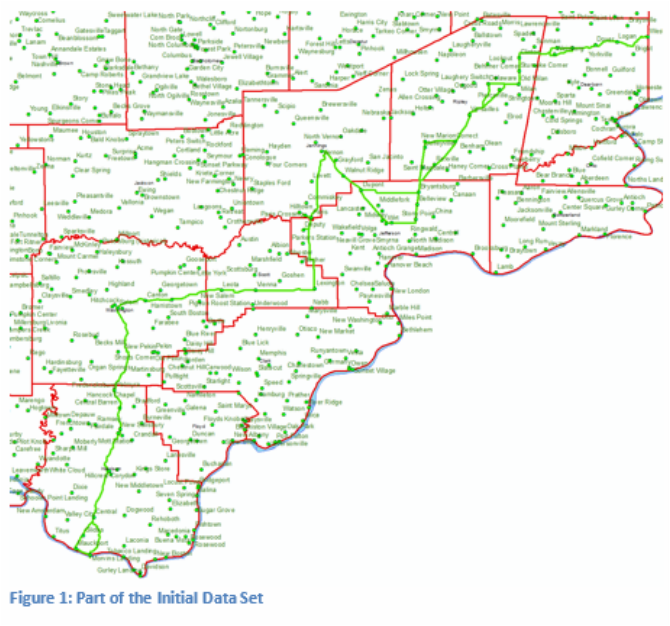
For Morgan’s Route: https://drive.google.com/open?id=12BZxF_1h9CFhKpFwXNtlrByHZ8-vV7jG go to Indiana as described above, select the Region tab and select the Morgan’s Raid Route file in Indiana. Figure 1 shows these four data sets, in which some symbology and labeling has
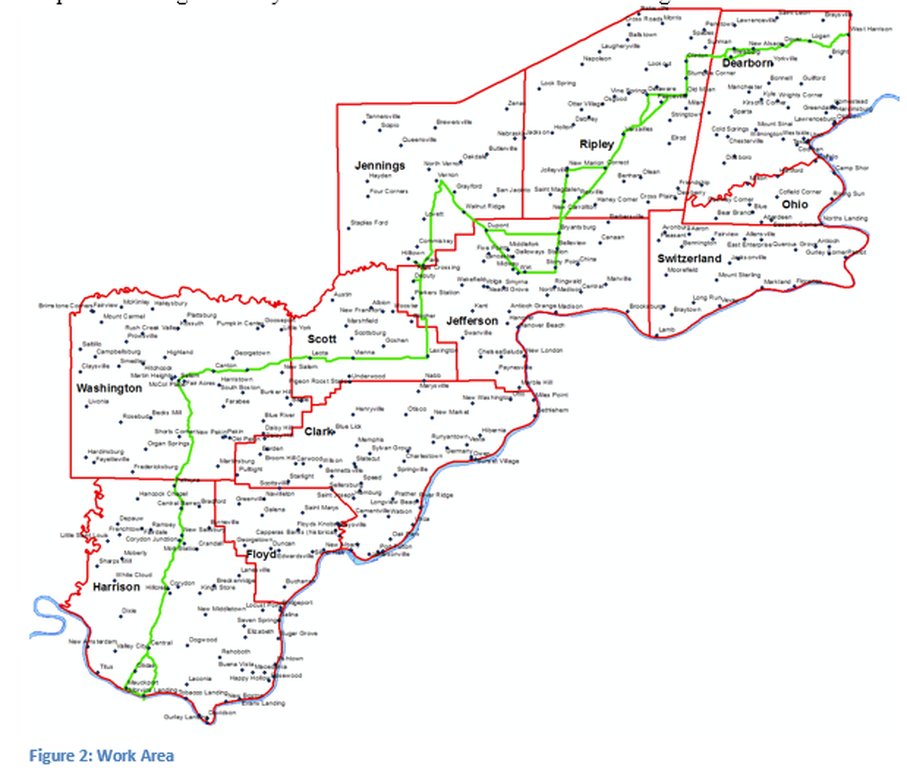
been completed. In Figure 2 only those counties in which John Hunt Morgan’s raid in Indiana occurred have been queried and a clipping of the named places has also been processed to create a data set containing only the desired information.
Historical Background of the Data Set
In July of 1863 Confederate General John Hunt Morgan, from Kentucky, entered the state of Indiana having already raided parts of Kentucky, having left from Tennessee. In this lesson the actual route taken by Morgan and his raiders has been created by using georeferencing and heads up digitization of historical maps which are in the public domain. The research included using sources to determine the actual pathways followed. The raid continued through the State of Ohio where Morgan and many of his men were captured.
The map that was created represents the portion of the raid that was in Indiana. The green line on Figure 2, represents the path of Morgan in Indiana, the red line is the county boundary, the blue line is the Ohio River and the dots represents named places in Indiana. The named places include both current and historical places. The counties within Indiana of the raid were Harrison, Washington, Floyd, Clark, Scott, Jennings, Jefferson, Ripley, Switzerland, Ohio and Dearborn. Once a map has been completed, similar to the look in Figure 2, the technical components of this lesson can be started. If different data sets are being used make sure that the data representation is ready for publication before proceeding.
The map that was created represents the portion of the raid that was in Indiana. The green line on Figure 2, represents the path of Morgan in Indiana, the red line is the county boundary, the blue line is the Ohio River and the dots represents named places in Indiana. The named places include both current and historical places. The counties within Indiana of the raid were Harrison, Washington, Floyd, Clark, Scott, Jennings, Jefferson, Ripley, Switzerland, Ohio and Dearborn. Once a map has been completed, similar to the look in Figure 2, the technical components of this lesson can be started. If different data sets are being used make sure that the data representation is ready for publication before proceeding.

