Labeling - Including Dynamic Zoom
Click here to download the data that the author used for the course lesson. By downloading the data you will be able to follow the steps completely.

Note: Click on the white "play" button to begin watching the video.
Above you will find a video version. If any conflicts in the documents are found always use those on the website instead of the video as the website can be updated quicker than other information as a version changes.
Introduction
The purpose of a label is to provide a map user information to assist in the understanding of the content being displayed. Labels should be placed in a manner in which features of the map are not hidden. In addition all colors on the map need to be complementary for both appearance and functionality. For example, a light yellow label on a dark yellow background is not functional.
There are two ways to think about map labels, a simple label which is visible on a static map and a dynamic label in which the label appears at certain zoom levels and not at others. The concepts and processes are similar, the label should be visible for the appropriate scale range of the map being viewed either manually or automatically. Labels are controlled for each shapefile in the property window using the label tab.
When creating a dynamic map it is important that labels turn on and off at the appropriate zoom levels, as well as making sure labels are appropriately placed. Properties of the label include color, font type and size. For example, if a map of the United States shows all the counties of the lower 48 states, labeling each county by name at this scale would not be appropriate and not provide any usable information. When zoomed into the state level, the county name being labeled would be appropriate. Automatic labeling is used in conjunction with the automatic zoom function for a layer, but they are independent properties. The designer may also decide that no labels should be placed outside of a polygon such as a county boundary or that all labels should be horizontal. The color of the label should be appropriate for the layer, such as the name of a river might be in blue or black, but not red.
The first part of this technical skills lesson will explore the functionality of labeling that works for both simple and dynamic zoom. The second part of the lesson will use the concepts learned in the first part and the methods for dynamic labeling.
Data
The data for this exercise will be provided by the instructor or selected by the learner that meets the required criteria. Sample data is located at:
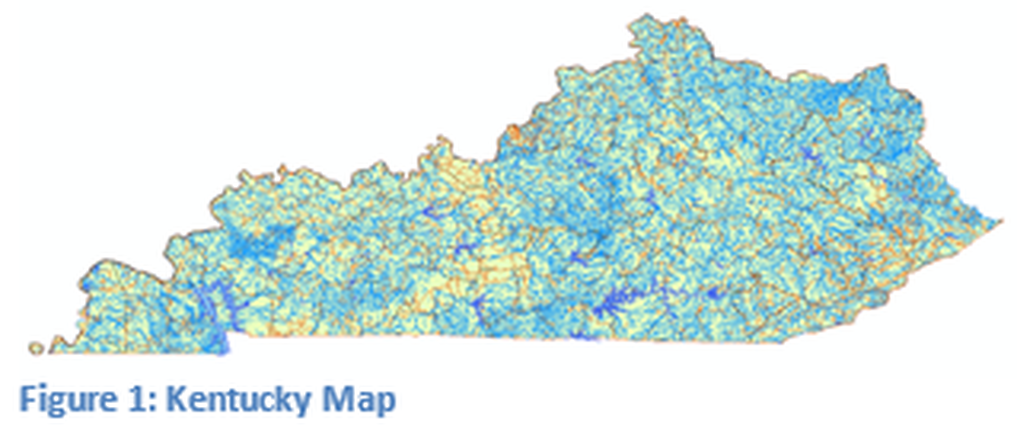
http://techcenter.jefferson.kctcs.edu/gis/data/Country/USA/State/State.html, download the Kentucky county boundary, Kentucky zip code, Kentucky rivers and Kentucky lakes. When all features are loaded on the map it should look similar to Figure 1. The map displayed in Figure 1 has too much information visible and there are no labels for any of the features. Note the colors of each feature were selected by the author prior to be displayed. To design and construct a map that is appropriate, labeling of features is an important consideration as much as deciding which features will be displayed. This technical skills lesson will only cover the concepts of labels. A discussion of dynamic feature construction, is a technical skill covered in a different lesson and will not be part of this lesson. The two topics have some similarities in how automated zoom works. Turn off all layers except for the county boundaries.

