Map Scale
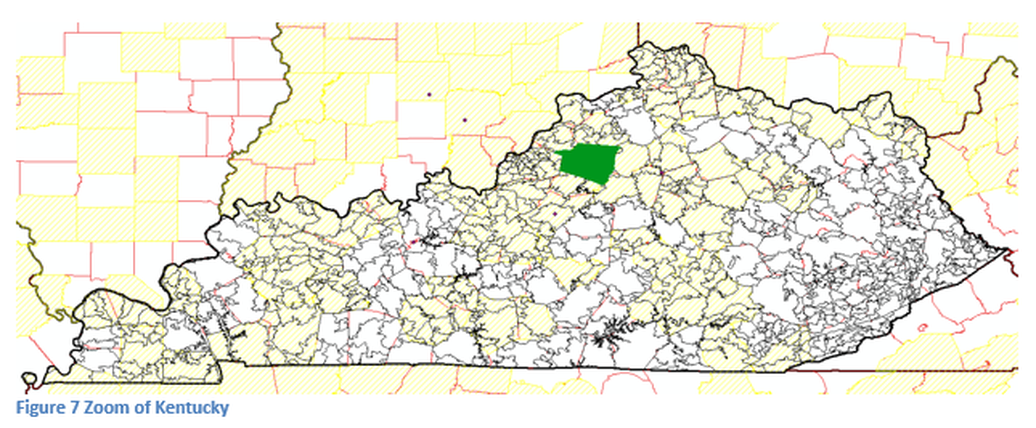
Zoom to the state of Kentucky, as shown in Figure 7, the details of the zip code layer are clearly visible. A few of the zip code polygons are very small and cannot be resolved in the more urban areas. No zip codes are visible in Shelby County, since an opaque layer is placed above the zip code layer.
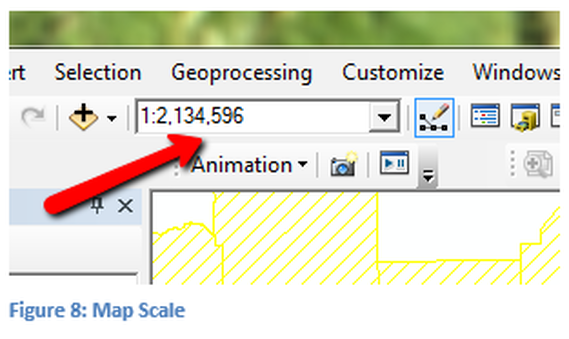
The map scale is displayed in the toolbar and is stated as a ratio (1:2,134,596), see Figure 8. Scale is used in determining automatic levels of visibility
|
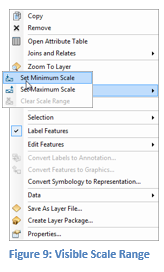
Scale RangeOne way to determine the visible scale of a layer is to establish what is currently viewed on the monitor. Right click on the Kentucky Zip Code layer, as seen in Figure 9, and select Visible Scale Range which will open another window. In this window the control settings for maximum, minimum or clear the visible scale range are available. For the zip code layer the current zoom will be the entire state, as the minimum visible scale range. This means that zip code boundaries will not be visible until we reach our current zoom level.
|
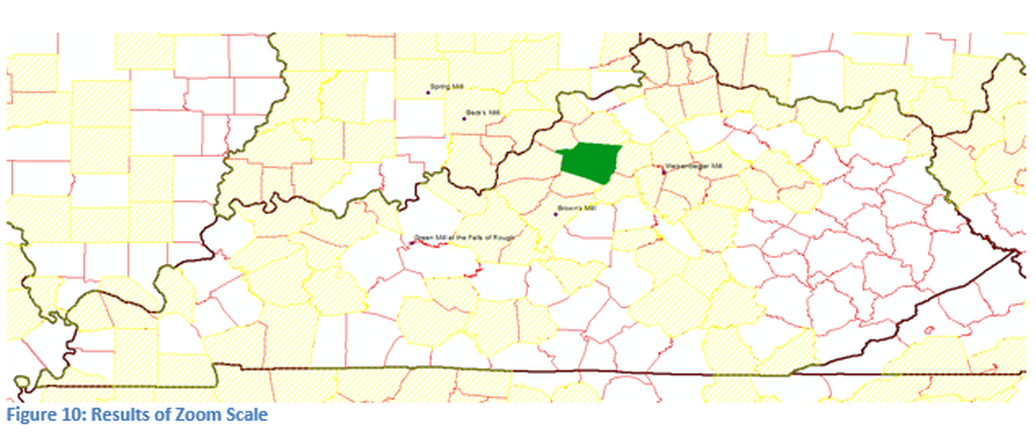
In Figure 10, the map has been slightly zoomed out beyond the level as seen in Figure 7. The zip code boundaries are no longer visible. The maximum range was not set which means the information is visible at all scale ranges as the scale range ratio decreases.
Scale Range Part II
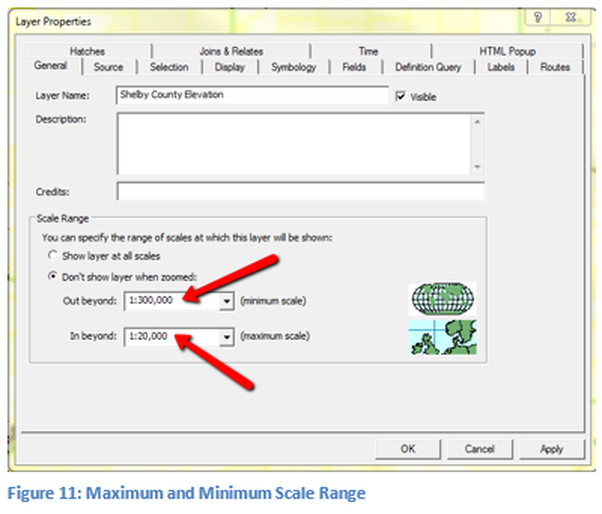
Open the Layer Properties window for Shelby County elevation and open to the General Tab. Select the Radio Button labeled, Don't show layer when zoomed. Use the following scale range for the layer, not visible before the zoom is 1:300,000 and not visible if the zoom is beyond 1:20,000. With these selections when the layer is first visible and when it will disappear has been chosen. If the number is larger than 300,000 the layer is not visible and if the number is smaller than 20,000 the layer is not visible. This is done to display the data in the most effective way. When at a very high zoom level the data may no longer make sense or the resolution of the data may have been lost at a very tight zoom. While these are vector files, line segments have a finite length when they no longer appear to be a curve but instead a series of straight line segments.
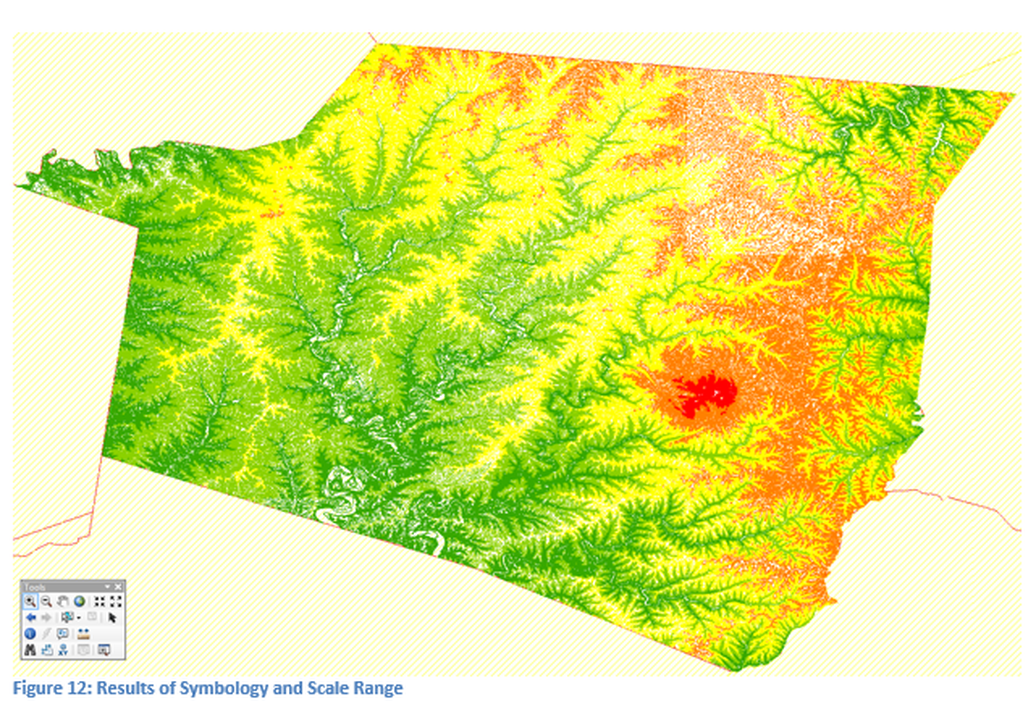
Using the Symbology tab a ramp color was established to produce a map of elevation control lines. The lines at this zoom level are so closely packed together it appears more like a raster image. Zoom into the Shelby County area so that the details are visible. The red areas are the higher elevations and the green lower elevations. Review the technical skills lesson on Symbology for additional information on how to create a similar image. When zoomed out beyond the preset range the layer will disappear and when zoomed into the specified range the layer also disappears since an upper and lower zoom range has been established.
|
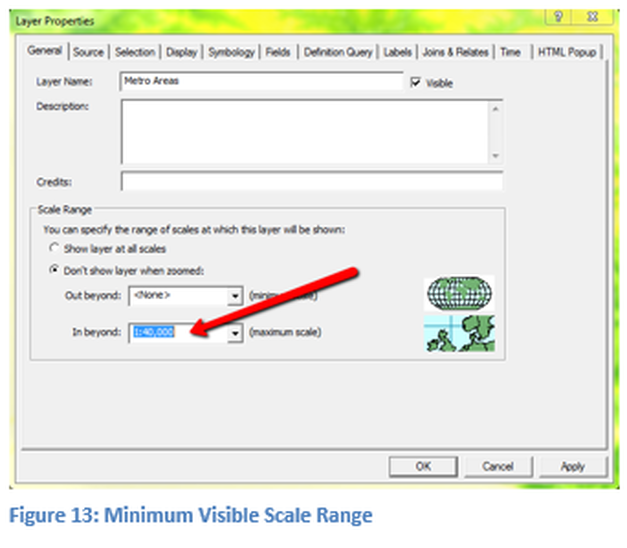
Scale Range Part IIIRight click on the U.S. Metro Areas and select Properties, then click on the General Tab. Select the Don't show layer when zoomed in beyond 1:40,000. Therefore, when zoomed in beyond 1:40,000 the metropolitan areas will no longer be visible. See Figure 13 for how the selection was made.
|
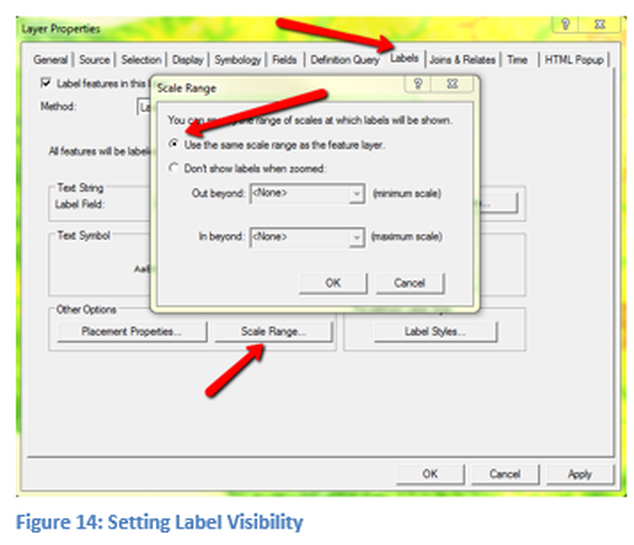
Select the Kentucky Zip Code dataset by right clicking on it and selecting Properties and then select the Labels Tab, as seen in Figure 14. Make sure the Label features in this layer are checked, then click on the scale range. Select Use the same scale range as the feature layer. Therefore, when the U.S. zip code shapefile is visible the labels will be as well and when not visible the U.S. zip code labels will not be visible. For additional information on dynamic labeling see the technical skills lesson on labelling.
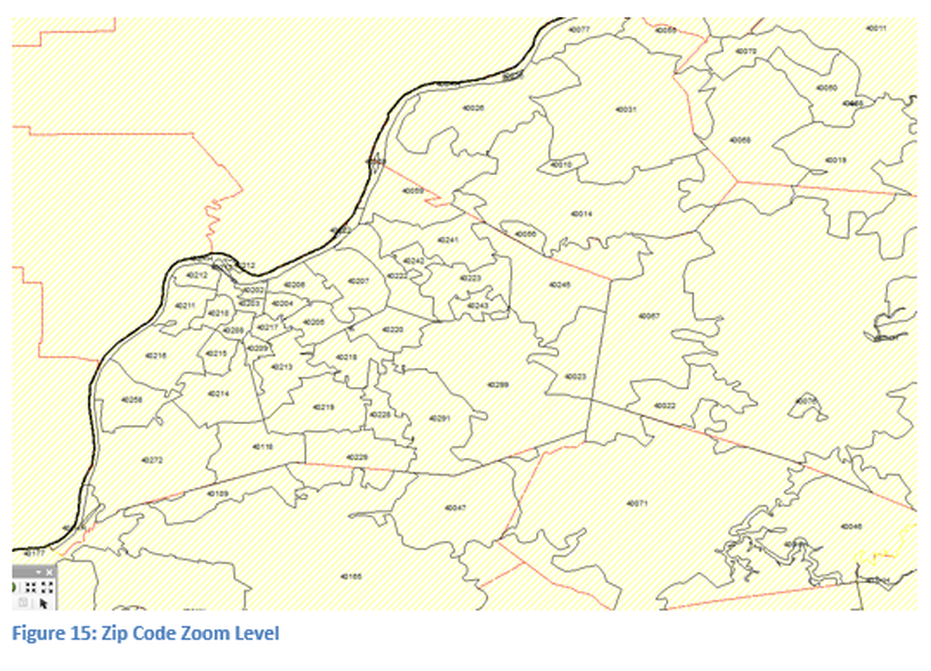
In figure 5, see the zip code numbers at this zoom level.
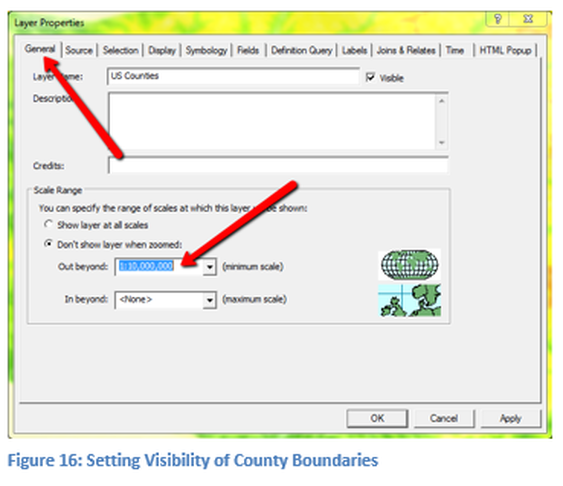
Right click on the US Counties and select Properties. Click on the General Tab (as seen in Figure 16) and select Don't show layer when zoomed Out beyond 1:10,000,000. Therefore, when we are viewing the entire country you will not see the county lines.
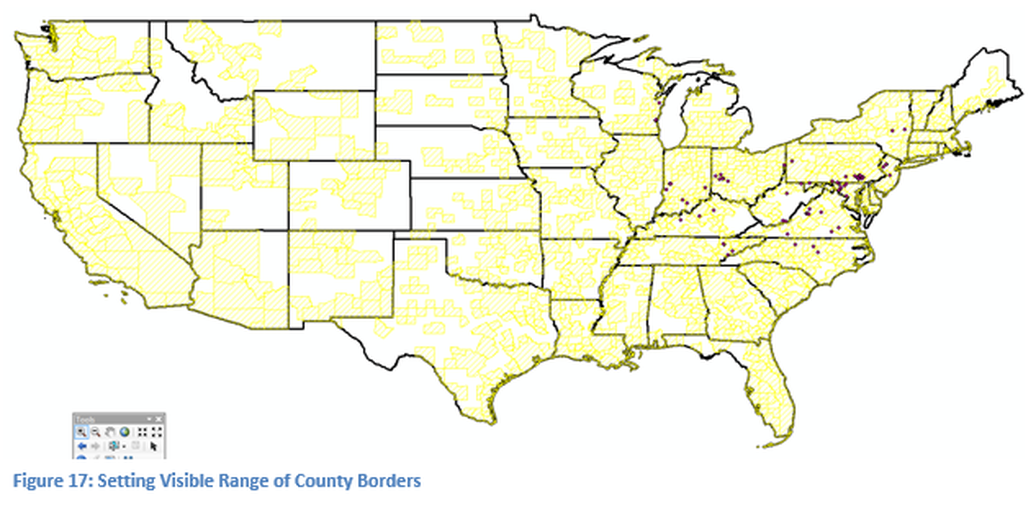
Zoom out to display the lower 48 states. Note that now county boundary lines are no longer visible, see Figure 17. Compare this view to that at the beginning of this lesson in Figure 1. No layers have been deleted, instead through the use of dynamic zoom it has been demonstrated what would be visible and when it would be visible. By using automated zoom, layers can be turn on and off as appropriate for the viewing scale. To complete the process step zoom through the map to show all the effects.

