Case III Query and Displaying Other Attributes
Clear the query from the previous case. This is done by opening the query window of the layer properties and deleting the query. Use the Query Builder to create a new query.
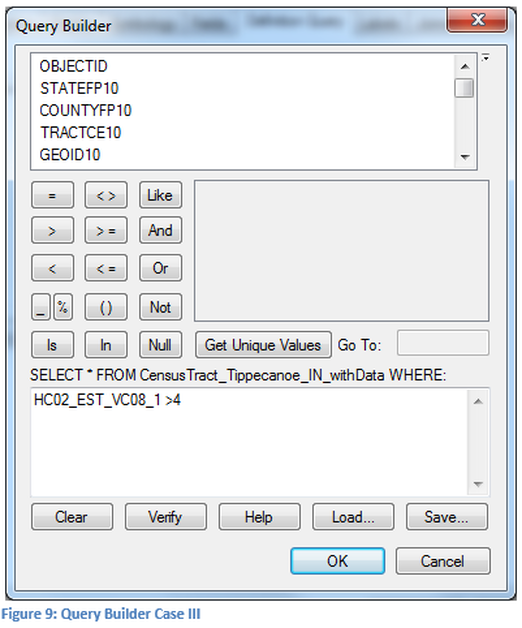
Use report S1501 (Note: this report will need to be tabular joined to the same census tract shapefile as the previous report, no query can be running when the attributes are not in the same file.) and select the attribute for males that have less than a 9th grade education (this field represents those that stopped their education before completion of the 9th grade and are 25 or older, full name HC02_EST_VC08_1 in S1501). This field is a percentage and not an actual numerical value, another field gives total population that is 25 and older. The query is looking at those census tracts in which less than 4% of the people have a 9th grade education as the end point of their education.
Use report S1501 (Note: this report will need to be tabular joined to the same census tract shapefile as the previous report, no query can be running when the attributes are not in the same file.) and select the attribute for males that have less than a 9th grade education (this field represents those that stopped their education before completion of the 9th grade and are 25 or older, full name HC02_EST_VC08_1 in S1501). This field is a percentage and not an actual numerical value, another field gives total population that is 25 and older. The query is looking at those census tracts in which less than 4% of the people have a 9th grade education as the end point of their education.
1. Select the field
2. Click on Get Unique Values to see the values in this field.
3. Construct the query as shown in figure 9.
4. Click OK to exit the query builder.
5. Click OK on the next window to execute the query.
2. Click on Get Unique Values to see the values in this field.
3. Construct the query as shown in figure 9.
4. Click OK to exit the query builder.
5. Click OK on the next window to execute the query.
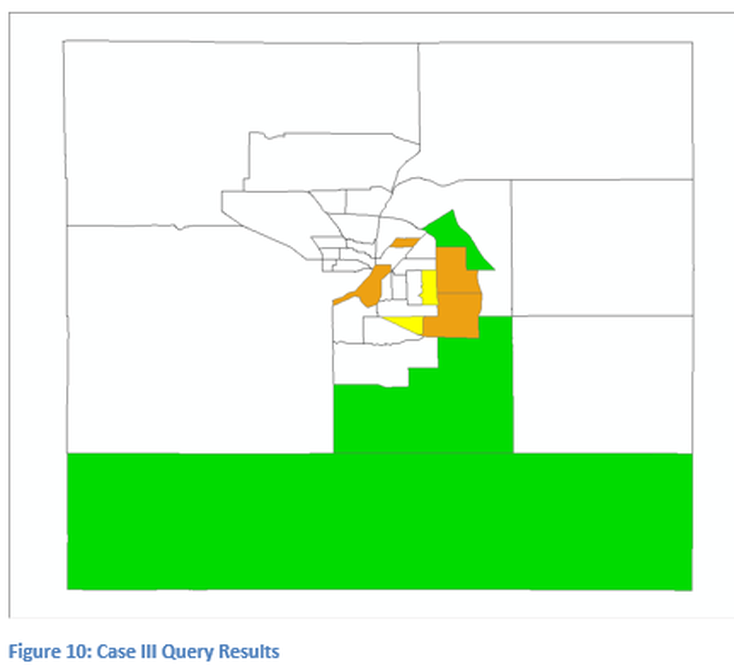
The layer visible in figure 10 is the HC02_EST_VC13 layer which is Median Income. The query is based on educational levels of males with less than a 9th grade education as their stopping points. So if you see a color layer it means that the criteria have been met, but what is displayed is the income level. No legend is provided so you do not have stats. But this example is used to show how one layer is visible based on a query of a different layer. It is interesting to note that no census tract that is visible has the highest income level. Most of the displayed tracts are from the lowest income levels. Note: the author knows the break point of the income levels.

